10-K: Annual report [Section 13 and 15(d), not S-K Item 405]
Published on February 17, 2026
UNITED STATES
SECURITIES AND EXCHANGE COMMISSION
Washington, D.C. 20549
FORM 10-K
For the fiscal year ended December 27 , 2025
FOR THE TRANSITION PERIOD FROM _____ TO _____
Commission file number 001-39609

(Exact name of registrant as specified in its charter)
(State or other jurisdiction of incorporation or organization) | (I.R.S. Employer Identification No.) | ||||
| , | ||||||||||||||||||||
| (Address of principal executive offices) | (Zip Code) | |||||||||||||||||||
Registrant's telephone number, including area code: (513 ) 851-4900
Securities registered pursuant to Section 12(b) of the Act:
| Title of Each Class | Trading Symbol(s) | Name of Each Exchange on Which Registered | ||||||
| Common Stock, par value $0.0001 per share | HLMN | The Nasdaq Stock Market LLC | ||||||
Securities registered pursuant to Section 12(g) of the Act: None
Indicate by check mark if the registrant is a well-known seasoned issuer, as defined in Rule 405 of the Securities Act. Yes ☐ No ☒
Indicate by check mark if the registrant is not required to file reports pursuant to Section 13 or 15(d) of the Act. Yes ☐ No ☒
Indicate by check mark whether the registrant (1) has filed all reports required to be filed by Section 13 or 15(d) of the Securities Exchange Act of 1934 during the preceding 12 months (or for such shorter period that the registrant was required to file such reports), and (2) has been subject to such filing requirements for the past 90 days. Yes ☒ No ☐
Indicate by check mark whether the registrant has submitted electronically and posted on its corporate Web site, if any, every Interactive Data File required to be submitted and posted pursuant to Rule 405 of Regulation S-T during the preceding 12 months (or for such shorter period that the registrant was required to submit and post such files). Yes ☒ No ☐
Indicate by check mark if disclosure of delinquent filers pursuant to Item 405 of Regulation S-K is not contained herein, and will not be contained, to the best of the registrant's knowledge, in definitive proxy or information statements incorporated by reference in Part III of this Form 10-K or any amendment to this Form 10-K. ☐
Indicate by check mark whether the registrant is a large accelerated filer, an accelerated filer, a non-accelerated filer, smaller reporting company, or an emerging growth company. See the definitions of “large accelerated filer,” “accelerated filer,” “smaller reporting company,” and “emerging growth company” in Rule 12b‑2 of the Exchange Act. (Check one):
| ☒ | Accelerated filer | ☐ | |||||||||
| Non-accelerated filer | ☐ (Do not check if a smaller reporting company) | Smaller reporting company | |||||||||
| Emerging growth company | |||||||||||
If securities are registered pursuant to Section 12(b) of the Act, indicate by check mark whether the financial statements of the registrant included in the filing reflect the correction of an error to previously issued financial statements. ☐
Indicate by check mark whether any of those error corrections are restatements that required a recovery analysis of incentive-based compensation received by any of the registrant’s executive officers during the relevant recovery period pursuant to §240.10D-1(b) ☐
Indicate by check mark whether the registrant is a shell company (as defined by Rule 12b-2 of the Exchange Act). Yes ☐ No ☒
The aggregate market value of the voting and non-voting stock held by non-affiliates of the registrant as of June 28, 2025, the last business day of the registrant's most recently completed second fiscal quarter, was $1,398 million based upon the closing price reported for such date on the Nasdaq Global Select Market.
On February 13, 2026, 196,590,905 shares of common stock, par value $0.0001 per share, were issued and outstanding.
Documents Incorporated by Reference: Part III of this 10-K incorporates by reference certain information from the registrants definitive Proxy Statement for the 2026 Annual Meeting of Stockholders.
| TABLE OF CONTENTS | ||||||||
| PART I | ||||||||||||||
| FORWARD-LOOKING STATEMENTS | ||
This annual report contains certain forward-looking statements, including, but not limited to, certain disclosures related to acquisitions, refinancing, capital expenditures, resolution of pending litigation, and realization of deferred tax assets, which are not historical facts and are subject to numerous assumptions, risks, and uncertainties. Statements that do not describe historical or current facts, including statements about beliefs and expectations, are forward-looking statements.
All forward-looking statements are made in good faith by the Company and are intended to qualify for the safe harbor from liability established by Section 27A of the Securities Act of 1933, Section 21E of the Securities Exchange Act of 1934, and the Private Securities Litigation Reform Act of 1995. You should not rely on these forward-looking statements as predictions of future events. Words such as "expect," "estimate," "project," "budget," "forecast," "anticipate," "intend," "plan," “target”, “goal”, "may," "will," "could," "should," "believes," "predicts," "potential," "continue," and similar expressions are intended to identify such forward-looking statements. These forward-looking statements include, without limitation, the Company’s expectations with respect to future performance. These forward-looking statements involve significant risks and uncertainties that could cause the actual results to differ materially from the expected results. Most of these factors are outside the Company's control and are difficult to predict. Factors that may cause such differences include, but are not limited to: (1) unfavorable economic conditions that may affect our and our customers’, suppliers’ and other business partners’ operations, financial condition and cash flows including spending on home renovation or construction projects, inflation, recessions, instability in the financial markets or credit markets; (2) increased supply chain costs, including tariffs, raw materials, sourcing, transportation and energy; (3) the highly competitive nature of the markets that we serve; (4) the ability to continue to innovate with new products and services; (5) seasonality; (6) large customer concentration; (7) the ability to recruit and retain qualified employees; (8) the outcome of any legal proceedings that may be instituted against the Company; (9) adverse changes in currency exchange rates; or (10) regulatory changes and potential legislation that could adversely impact financial results. The foregoing list of factors is not exclusive, and readers should also refer to those risks that are included in the Company’s filings with the Securities and Exchange Commission (“SEC”), including this Annual Report on Form 10-K. Given these uncertainties, current or prospective investors are cautioned not to place undue reliance on any such forward looking statements.
Except as required by applicable law, the Company does not undertake or accept any obligation or undertaking to release publicly any updates or revisions to any forward-looking statements in this communication to reflect any change in its expectations or any change in events, conditions or circumstances on which any such statement is based.
| ITEM 1 - BUSINESS. | ||
General
Hillman Solutions Corp. and its wholly-owned subsidiaries (collectively, “Hillman” or “Company”) are one of the largest providers of hardware-related products and related merchandising services to retail markets in North America. Our principal business is operated through our wholly-owned subsidiary, Hillman, which had net sales of approximately $1,552.2 million in 2025. Hillman sells its products to hardware stores, home centers, mass merchants, pet supply stores, and other retail outlets principally in the United States, Canada, Mexico, Latin America, and the Caribbean. Product lines include thousands of small parts such as fasteners and related hardware items; threaded rod and metal shapes; keys; builder's hardware; personal protective equipment, such as gloves and eye-wear; rope and chain; and identification items, such as tags and letters, numbers, and signs. We support product sales with services that include design and installation of merchandising systems, maintenance of appropriate in-store inventory levels, and break-fix for our robotics kiosks.
2| December 27, 2025 Form 10-K | ||||||||
Hillman's corporate headquarters is located at 1280 Kemper Meadow Drive, Cincinnati, Ohio. We maintain a website at www.hillmangroup.com. Information contained or linked on our website is not incorporated by reference into this annual report and should not be considered a part of this annual report.
History
In 1964, Max Hillman established Hillman Bolt & Screw Corporation in Cincinnati, Ohio when he purchased a franchise operation from Sharon Bolt & Screw, a hardware fastener company. Max began distributing fasteners to independent hardware stores in southern Ohio and northern Kentucky, with a relentless commitment to service.
Max’s two sons, Mick Hillman and Rick Hillman, joined their father’s company in 1969, as Hillman’s customer base and distribution network continued to grow. In 1982, Hillman Bolt & Screw was purchased by Sun Distributors followed by Max’s retirement shortly thereafter. Mick and Rick took over the day-to-day operations of the business in 1984.
During the early 1990s, the Company developed its National Field Service Group, which today includes over 1,200 field service and sales representatives, to manage the complex assortment of Hillman products on its customers’ shelves. Over the next three decades Hillman continued to win new business, expanding from traditional hardware stores to big box and home improvement retailers, and into adjacent product categories through multiple strategic acquisitions.
During the 2000s, Hillman was purchased three separate times by private equity firms (2001, 2004 and 2010). During 2012 and 2013, Rick and Mick Hillman retired, respectively, after more than 40 years of actively managing the Company. Thereafter in 2014, CCMP Capital Advisors acquired the majority interest in Hillman. In 2021, Hillman became a publicly traded company, listing its shares on the Nasdaq stock exchange under the ticker symbol “HLMN” by virtue of a merger with a Special Purpose Acquisition Company ("SPAC").
Hillman’s legacy of service has remained unchanged throughout its history, and it continues to take care of its customers first.
Hillman Group
We are comprised of three separate operating business segments: (1) Hardware and Protective Solutions, (2) Robotics and Digital Solutions, and (3) Canada.
We provide products such as fasteners and related hardware items; threaded rod and metal shapes; keys and key duplication systems; builder's hardware; rope and chain; protective solutions, such as gloves, eye-wear, and cleaning rags; and identification items, such as tags and letters, numbers, and signs to retail outlets, primarily hardware stores, home centers and mass merchants, pet supply stores, grocery stores, and drug stores. We complement our extensive product selection with regular retailer visits by our field sales and service organization.
We market and distribute a wide variety of Stock Keeping Units (“SKUs”) of small, hard-to-find and hard-to-manage hardware items. We function as a category manager for retailers and support these products with in-store service, high order fill rates, and rapid delivery of products sold. Sales and service representatives regularly visit retail outlets to review stock levels, reorder items in need of replacement, and interact with the store management to offer new product and merchandising ideas. Thousands of items can be actively managed with the retailer experiencing a substantial reduction of in-store labor costs and replenishment paperwork. Service representatives also assist in organizing the products in a consumer-friendly manner. We complement our broad range of products with merchandising services such as displays, product identification stickers, retail price labels, store rack and drawer systems, assistance in rack positioning and store layout, and inventory restocking services. We regularly refresh retailers' displays with new products and package designs utilizing color-coding to simplify the shopping experience for consumers and improve the attractiveness of individual store displays.
We operate from 24 strategically located distribution centers in North America and supplement our operations with third-party logistics providers to warehouse and ship customer orders in the certain areas.
Products and Suppliers
Our product strategy concentrates on providing total project solutions using the latest technology for common and unique home improvement projects. Our portfolio provides retailers the assurance that their shoppers can find the right product at the right price within an 'easy to shop' environment.
We currently manage a worldwide supply chain comprised of a large number of vendors, the largest of which accounted for approximately 7.6% of the Company's annual purchases and the top five of which accounted for approximately 17.2% of our annual purchases. Our vendor quality control procedures include on-site evaluations and frequent product testing. Vendors are also evaluated based on delivery performance and the accuracy of their shipments.
3| December 27, 2025 Form 10-K | ||||||||
Hardware and Protective Solutions
Our Hardware and Protective Solutions segment includes a variety of product categories including: Fasteners; Builders Hardware; Wall Hanging, Threaded Rod and Metal Shapes; Rope and Chain; Letters, Numbers, and Signs ("LNS"); and Personal Protective Equipment, such as gloves and eye-wear.
Our Fastener business consists of three categories: core fasteners, construction fasteners, and anchors. These are sold under a variety of brands including Hillman, Fas-n-Tite, Deck-Plus, and Power Pro. Core fasteners include nuts, bolts, screws, washers, and specialty items. Construction fasteners include deck, drywall, metal screws, and both hand driven and collated nails. Anchors include hollow wall and solid wall items such as plastic anchors, toggle bolts, concrete screws, and wedge anchors.
Builders Hardware includes a variety of common household items such as coat hooks, door stops, hinges, gate latches, and decorative hardware. We market the builder's hardware products under the Hardware Essentials® brand and provide our retailer partners with innovation in both product and merchandising solutions. The Hardware Essentials® program utilizes modular packaging, color coding, and integrated merchandising to simplify the shopping experience for consumers. Colorful signs, packaging, and installation instructions guide the consumer quickly and easily to the correct product location in store, while digital content including pictures and videos assist the online journey. Hardware Essentials® provides retailers and consumers decorative upgrade opportunities through contemporary finishes and designs.
The Wall Hanging category includes traditional picture hanging hardware, primarily marketed under the OOK® and Hillman brands, and the High & Mighty® series of tool-free wall hangers, decorative hooks and floating shelves that was launched in 2017.
We are the leading supplier of Threaded Rod and Metal Shapes in the retail market. The SteelWorks® threaded rod product includes hot and cold rolled rod, both weldable and plated, as well as a complete offering of All-Thread rod in galvanized steel, stainless steel, and brass. The SteelWorks® program is carried by many top retailers, including Lowe's and Menard's, and through cooperatives such as Ace Hardware. In addition, we are the primary supplier of Metal Shapes to many wholesalers throughout the country. With our acquisition of Koch in January 2024, we are now a premier provider and merchandiser of rope and twine, chain and wire rope, and related hardware products.
LNS includes product lines that target both the homeowner and commercial user. Product lines within this category include individual and/or packaged letters, numbers, signs, safety related products (e.g. 911 signs), driveway markers, and a variety of sign accessories.
Our expansive Personal Protective Equipment category covers many uses for DIYer ("Do It Yourself") around the house and for the professional at the job site. Our products can be found at leading retailers across North America.
We distribute a full assortment of work gloves under the Firm Grip®, True Grip®, and Gorilla Grip brands; automotive gloves including Grease Monkey®; Digz® gardening gloves and more; as well as cleaning and all-purpose gloves. As a category leader in work gloves, our portfolio is founded on design and consumer driven innovation.
Our work-gear products consist of tool storage, knee pads, clothing, and other accessories sold under variety of brands including AWP®, McGuire Nicholas®, and Firm Grip®. The portfolio offers a “one stop shop” for leading retailers with an expansive assortment to meet the needs of both the pro and DIYer.
Our safety products include face masks and safety vests sold under a variety of brands including Firm Grip®, AWP®, and Premium Defense®. Focusing on innovative materials, intuitive design, and industry trends, we expect growth in the Hardware and Protective Solutions segment.
With our acquisition of Intex in August 2024, our cleaning products category now includes wiping cloths, consumable rags, and cleaning textiles used for painting, general cleaning, maintenance, janitorial and auto/marine care applications.
Hardware and Protective Solutions generated approximately $1,194.0 million, $1,108.0 million and $1,090.5 million of revenues in the years ended December 27, 2025, December 28, 2024, and December 30, 2023, respectively.
Robotics and Digital Solutions
Our Robotics and Digital Solutions segment consists primarily of software-enabled robotic key duplication and engraving solutions that are tailored to the unique needs of the consumer. Robotics and Digital Solutions products are located in high-foot traffic areas where retailers can provide consumers with on-the-spot, customized licensed and unlicensed key and engraving options. Our offerings include store associate assisted key duplication and self-service robotic engraving and key duplication kiosks; together with related software, systems, keys and key fobs. Our services include product and category management, merchandising services, and access to our proprietary robotic key duplicating and engraving software platforms and equipment.
4| December 27, 2025 Form 10-K | ||||||||
We design and manufacture proprietary software and equipment in our Boulder, Colorado and Tempe, Arizona facilities; housing the cornerstone for our key duplication business. Our key duplication system is offered in various retail channels including mass merchants, home centers, automotive parts retailers, franchise and independent hardware stores, and grocery/drug chains. We believe we provide the most diverse key duplication systems in the industry, through our unique combination of self-service kiosk technology and store associate assisted duplication systems. Equipment branding allows us to meet the individual needs of retailers. Our self-service solutions are driven by our MinuteKey technology, while store associate assisted duplication currently uses the state-of-the-art KeyKrafter® equipment and other legacy duplication machines.
Our MinuteKey self-service kiosk uses robotics technology in an innovative way that is accurate, easy to use, convenient, fast and highly reliable. We utilize a proprietary network integration software within our MinuteKey kiosks to maintain high levels of machine up-time and ensure machines have the optimal mix of key types available for duplication. The kiosk is completely self-service and has a 100% customer satisfaction guarantee. We manufacture and support the MinuteKey kiosk out of our Boulder, Colorado and Tempe, Arizona facilities.
Hillman KeyKrafter® is our most popular, innovative, and effective store associate assisted key duplication kiosk. It provides significant reduction in duplication time while increasing accuracy and ease of use for unskilled store associates. Additionally, with the KeyKrafter® solution, the capability exists for consumers to securely store and retrieve digital back-ups of their key without the original through the revolutionary Hillman KeyHero® Technology. Our Precision Laser Key System™ uses a digital optical camera, lasers, and proprietary software to scan a customer’s key. The system identifies the key and retrieves the key’s specifications, including the appropriate blank and cutting pattern, from a comprehensive database. This technology automates nearly every aspect of key duplication and provides the ability for every store associate to cut a key accurately. In the automotive key space, we offer the SmartBox Automotive Key Programmer which is a tool to quickly and easily pair transponder keys, remotes, and smart keys.
We retain ownership of the key duplicating equipment and market and sell keys. Our proprietary key offering features the universal blank which uses a “universal” keyway to replace up to five original equipment keys. We continually refresh the retailer’s key offerings by introducing decorated and licensed keys. Our key offering features decorative themes of art and popular licenses such as NFL, Disney, Breast Cancer Awareness, and Marvel to increase personalization, purchase frequency and average transaction value per key.
All of our key duplication systems are supported by a dedicated in store kiosk sales and service team.
In our engraving business, we supply a variety of innovative options of consumer-operated robotic kiosks such as Quick-Tag®, TagWorks®, and FIDO® for engraving specialty items such as pet identification tags, luggage tags, and other engraved identification tags. We have developed unique engraving systems leveraging state-of-the-art technologies to provide a customized solution for mass merchant, pet supply retailers, and other high traffic areas such as theme parks, all supported by our in store kiosk field service technicians. We design, engineer, manufacture, and assemble the engraving kiosks in our Boulder, Colorado and Tempe, Arizona facilities.
Our engraving business focuses on the growing consumer spending trends surrounding personalized and pet identification. Innovation has played a major role in the development of our engraving business unit. From the original Quick-Tag® consumer-operated kiosk system to the proprietary laser system of TagWorks®, we continue to lead the industry with consumer-friendly engraving solutions. As in our key business, we retain ownership of the key engraving equipment and market and sell blank tags.
Robotics and Digital Solutions generated approximately $220.2 million, $216.7 million, and $229.5 million of revenues in the years ended December 27, 2025, December 28, 2024, and December 30, 2023, respectively.
Canada
Our Canada segment distributes fasteners and related hardware items, threaded rod, keys, key duplicating systems, accessories, and identification items, such as tags and letters, numbers, and signs to hardware stores, home centers, mass merchants, industrial distributors, automotive aftermarket distributors, and other retail outlets and industrial Original Equipment Manufacturers (“OEMs”) in Canada. The product lines offered in our Canada segment are consistent with the product offerings detailed in our other segments. The Canada segment also produces made to order screws and self-locking fasteners for automotive suppliers, OEMs, and industrial distributors.
Our Canada segment generated approximately $138.1 million, $147.9 million and $156.5 million of revenues in the years ended December 27, 2025, December 28, 2024, and December 30, 2023, respectively.
Markets and Customers
We sell our products to national accounts such as Home Depot, Lowe’s, Tractor Supply, Walmart, Menard’s, PETCO, and PetSmart. Our status as a national supplier of proprietary products to big box retailers allows us to develop a strong market position and high barriers to entry within our product categories.
5| December 27, 2025 Form 10-K | ||||||||
We service a wide variety of franchise and independent retail outlets. These individual dealers are typically members of the larger cooperatives, such as Ace Hardware and Do It Best Corp. We ship directly to the cooperative members' independent retail locations and also supply many items to the cooperative's central warehouses. These central warehouses distribute to their members that do not have a requirement for Hillman's in-store service. These arrangements concentrate credit risk and logistic expenses for us while also reducing central warehouse inventory and delivery costs for the cooperatives.
A typical hardware store maintains thousands of different items in inventory, many of which generate small dollar sales but large profits. It is difficult for a retailer to economically monitor all stock levels and to reorder the products from multiple vendors. This problem is compounded by the necessity of receiving small shipments of inventory at different times and stocking the goods. The failure to have these small items available will have an adverse effect on store traffic, thereby possibly denying the retailer the opportunity to sell items that generate higher dollar profits.
We sell our products to a large volume of customers, the top two of which accounted for approximately $674.3 million, or approximately 43% of our total revenues in 2025. For the year ended December 27, 2025, Home Depot was the single largest customer, representing approximately $349.9 million or 22.5% of our total revenues and Lowe's was the second largest customer at approximately $324.4 million or 20.9% of our total revenues. No other customer accounted for more than 10% of total revenues in 2025. In the years ended December 27, 2025, December 28, 2024 and December 30, 2023, we derived over 10% of our total revenues from Lowe's and Home Depot which operated in each of our operating segments. See Note 17 - Concentration of Credit Risks of the Notes to Consolidated Financial Statements for additional information.
Certain customers operate using a purchasing cooperative(s) business model. In this model, independently owned hardware stores make purchases directly from the Company and are invoiced through a billing arrangement with a cooperative. Under this arrangement, the Company would invoice and receive payment from the cooperative for the product shipped directly to the store, and the cooperative would be responsible for invoicing and collecting from the independently owned hardware store. Due to the nature of the cooperative billing arrangement, the risk of collection of the receivables generated by sales to these independently owned hardware stores is concentrated with the cooperative. The Company does not believe a sales concentration exists in these scenarios, as the independently owned hardware stores can continue to make purchases from the Company via a direct bill arrangement or via another purchasing cooperative. As of December 27, 2025 approximately 17.1% of the Company's accounts receivable was derived through the Ace Hardware purchasing cooperative. See Note 17 - Concentration of Credit Risks of the Notes to Consolidated Financial Statements for additional information.
Hillman continues to expand its B2B eCommerce platform allowing certain customers to order online through the Company’s website, www.hillmangroup.com. The B2B eCommerce platform features many of our items available for sale online and over thousands of customers are enrolled with the online ordering platform. We continue to support direct-to-store and direct-to-consumer fulfillment for consumers who choose to order fasteners directly from retailers' websites.
Sales and Marketing
We believe that our primary competitive advantage is rooted in our ability to provide a greater level of customer service than our competitors. We partner with our customers to understand the unmet needs of consumers, design creative solutions, and commercialize those solutions, bringing them to life in both physical and digital channels through a tight alignment between the product management, marketing communications, and channel marketing functions. We provide best in class support and customer service at every touch point for our retail partners. Service is the hallmark of Hillman company-wide, employing 1,263 full-time and 122 part-time people on our sales and service team. The national accounts field service organization consists of approximately 819 employees and 153 field managers focusing on big box retailers, pet super stores, large national discount chains, and grocery stores. This organization reorders products, details store shelves, and sets up in-store promotions. Many of our largest customers use Electronic Data Interchange (“EDI”) for processing of orders and invoices.
We employ what we believe to be the largest direct sales force in the industry. The sales force, which consists of approximately 257 employees and is managed by 34 field managers, focuses on the franchise and independent customers. The depth of the sales and service team enables us to maintain consistent call cycles ensuring that all customers experience proper stock levels and inventory turns. This team also prepares custom plan-o-grams of displays to fit the needs of any store and establishes programs that meet customers' requirements for pricing, invoicing, and other needs. This group also benefits from daily internal support from our inside sales and customer service teams. On average, each sales representative is responsible for approximately 73 full service accounts that the sales representative calls on approximately every two weeks. These efforts allow the sales force to sell and support our product lines.
6| December 27, 2025 Form 10-K | ||||||||
Competition
Our primary competitors in the national accounts marketplace for fasteners are Primesource Building Products, Inc., Midwest Fastener Corporation, Illinois Tool Works Inc., Spectrum Brands, and competition from direct import by our customers. Our national competitors for gloves and personal protective equipment include Techtronic Industries, West Chester Protective Gear, PIP, Iron Clad, and MidWest Quality Gloves, Inc. Competition is primarily based on sourcing and price. We believe our product innovation and in store merchandising service create a more compelling and unique experience for both the consumer and our customers. Other competitors are local and regional distributors. Competitors in the pet tag market are specialty retailers, direct online order, and retailers with in-store mail order capability. The Quick-Tag®, FIDO®, and TagWorks® systems have patent protected technology that is a major barrier to entry and helps to preserve this market segment.
The principal competitor for our franchise and independent hardware store customers is Midwest Fastener Corporation. The hardware outlets that purchase our products without regularly scheduled sales representative visits may also purchase products from local and regional distributors and cooperatives. We compete primarily on field service, merchandising, as well as product availability and price, and depth of product line.
Insurance Arrangements
Under our current large deductible insurance programs, we retain the exposure on certain expected losses related to workers' compensation, general liability, and automobile claims up to the applicable deductibles. Our primary and umbrella policies provide coverage for catastrophic exposure and aggregate losses in excess of applicable deductibles. We also retain the exposure on expected losses related to health benefits of certain employees. We believe that our present insurance is adequate for our businesses. See Note 15 - Commitments and Contingencies, of the Notes to Consolidated Financial Statements.
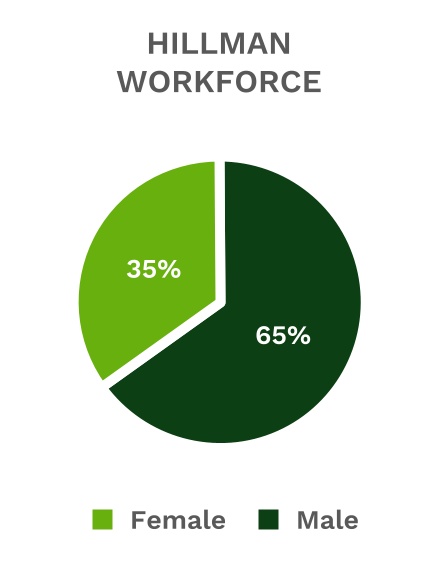
Human Capital Resources
Employees
As of December 27, 2025, we had 3,986 full time and part time employees, none of which were covered by a collective bargaining agreement. In our opinion, employee relations are good.
Health and Safety
Employee health and safety is a top priority in all aspects of our business. We are committed to providing a healthy environment and safe workplace at all our facilities and in the field. Our dedicated Safety Team oversees our health & safety program and procedures. We implement robust safety protocols across all operations, maintain a Safety Compliance Program, and regularly conduct self-assessments to examine our safety culture and processes.
SAFETY MEASURE1 | ||||||||
Total Recordable Incident Rate (TRIR) | 1.81 | |||||||
Days Away Restricted Transferred (DART) | 1.02 | |||||||
1 Data spans 12 months between January 2025 and December 2025.
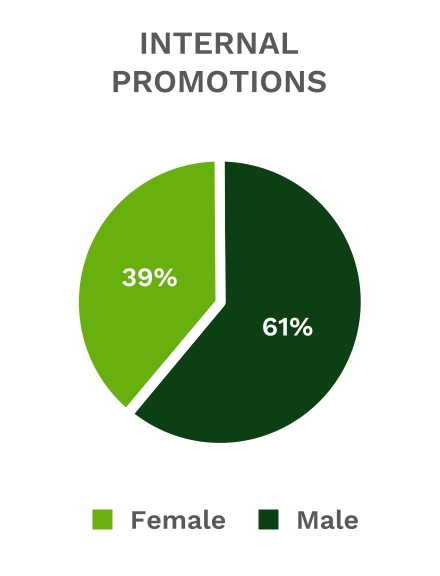
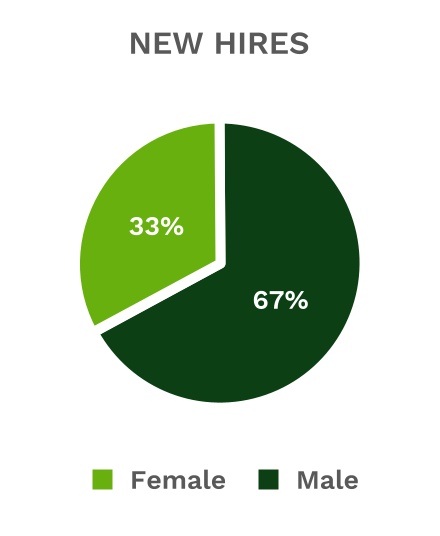
Attraction, Development, and Retention
The success of our efforts to grow our business depends on the contributions and abilities of key executives, our sales force, and other personnel. Our Human Resources department leads the search to reach a large talent pool. We have a standard framework for posting jobs, interviewing for open positions, and onboarding new employees. We offer employees resources to continuously improve their skills and performance with the goal of further cultivating our team. We seek people who are demonstrate our core values: absolute integrity, accountability to our team and customers, the ability to build on difference, trust and respect.
Diversity and Inclusion
We are committed to actions that build an inclusive and equitable workplace where all employees are valued and leveraged. We ask our employees to bring their authentic selves to work every day and this shows in both our
7| December 27, 2025 Form 10-K | ||||||||
products and our services. We are committed to creating equal opportunities for employment, and creating inclusive and diverse workplaces that allow our team to perform to their fullest potential.
Backlog
We do not consider the sales backlog to be a significant indicator of future performance due to the short order cycle of our business. Our sales backlog from ongoing operations was approximately $21.2 million as of December 27, 2025 and approximately $26.0 million as of December 28, 2024. We expect to realize the entire December 27, 2025 backlog during fiscal 2026.
Where You Can Find More Information
We file quarterly reports on Form 10-Q and annual reports on Form 10-K and furnish current reports on Form 8-K and other information with the Securities and Exchange Commission (the “Commission”). The Commission also maintains an Internet site at www.sec.gov that contains quarterly, annual, and current reports, proxy and information statements, and other information regarding issuers, like Hillman, that file electronically with the Commission.
In addition, our quarterly reports on Form 10-Q, annual reports on Form 10-K, current reports on Form 8-K, and all amendments to those reports, are available free of charge on our website at www.hillmangroup.com as soon as reasonably practicable after such reports are electronically filed with the Commission. We are providing the address to our website solely for the information of investors. We do not intend the address to be an active link or to incorporate the contents of the website into this report.
| ITEM 1A - RISK FACTORS. | ||
You should carefully consider the following risks. However, the risks set forth below are not the only risks that we face, and we face other risks which have not yet been identified or which are not yet otherwise predictable. If any of the following risks occur or are otherwise realized, our business, financial condition, and results of operations could be materially adversely affected. You should carefully consider the risks described below and all other information in this Annual Report on Form 10-K, including our Consolidated Financial Statements and the related Notes to Consolidated Financial Statements and schedules thereto.
Risks Relating to Our Products and Demand for our Products:
8| December 27, 2025 Form 10-K | ||||||||
Our sales are dependent upon the health and stability of the general economy. Adverse changes in economic factors specific to the home improvement industry may adversely affect our sales and financial performance.
Many North American and global economic factors may adversely affect our financial performance. These include, but are not limited to, periods of slow economic growth or recession, home price appreciation or decreasing housing turnover, volatility and/or lack of liquidity from time to time in U.S. and world financial markets and the consequent reduced availability and/or higher cost of borrowing to Hillman, its customers, and consumers, slower rates of growth in real disposable personal income that could affect the rate of growth in consumer spending, inflation and its impacts on discretionary spending and on our costs, shortages, and other disruptions in the labor supply, consumer debt levels, changes in tax rates and policy, outbreak of pandemics, fluctuations in fuel and energy costs, inflation or deflation of commodity prices, natural disasters, armed conflicts, and acts of both domestic and international terrorism.
Sales of many of our products are driven by the activity level of home repair and remodel projects. Our customers, suppliers, and other parties with whom we do business are also impacted by the foregoing conditions and adverse changes may result in financial difficulties leading to restructurings, bankruptcies, liquidations, and other unfavorable events for our customers, consumers, suppliers, and other service providers. Adverse trends in any of the foregoing factors could reduce our sales, adversely impact the mix of our sales, or increase our costs, which could have a material adverse effect on our business, financial condition and results of operations.
Large customer concentration and the inability to penetrate new channels of distribution could adversely affect our business.
Our two largest customers constituted approximately $674.3 million of net sales and $33.0 million of the year-end accounts receivable balance for 2025. Both of these customers are big box chain stores. Our results of operations depend greatly on our ability to maintain existing relationships and arrangements with these big box chain stores. To the extent that the big box chain stores are materially adversely impacted by the changing retail landscape, this could have a negative effect on our results of operations. These two customers have been key components of our growth and failure to maintain fulfillment and service levels or relationships with these customers could result in a material loss of business. Our inability to penetrate new channels of distribution, including ecommerce, may also have a negative impact on our future sales and business (see Note 17 - Concentration of Credit Risks of the Notes to Consolidated Financial Statements for additional information).
If a large customer experiences a material decline in its business, that could have a negative impact on our ability to collect outstanding accounts receivable or continue future sales and business with that customer, which could have a material adverse effect on our financial condition, results of operations, and ability to generate future sales and cash flow from that customer. This occurred on October 14, 2024, when True Value Company, LLC and certain of its affiliates (collectively, "True Value"), filed a voluntary petition for relief under Chapter 11 of the United States Bankruptcy Code that impaired the collectability of our accounts receivable and resulted in us recording a charge of $8.6 million in 2024.
To compete successfully, we must develop and commercialize a continuing stream of innovative new products that create consumer demand.
Our long-term success in the current competitive environment depends on our ability to develop and commercialize a continuing stream of innovative new products which create and maintain consumer demand. We also face the risk that our competitors will introduce innovative new products that compete with our products. Our strategy includes increased investment in new product development and continued focus on innovation. There are, nevertheless, numerous uncertainties inherent in successfully developing and commercializing innovative new products on a continuing basis, and new product launches may not provide expected growth results.
Acquisitions have formed a significant part of our growth strategy in the past and may continue to do so. If we are unable to identify suitable acquisition candidates, successfully integrate an acquired business, or obtain financing needed to complete an acquisition, our growth strategy may not succeed.
Historically, our growth strategy has relied in part on acquisitions that either expand or complement our businesses and/or product offerings in new or existing markets. However, there can be no assurance that we will be able to identify or acquire acceptable acquisition candidates on terms favorable to us and in a timely manner.
The process of integrating acquired businesses into our operations may result in unforeseen difficulties and may require a disproportionate amount of resources and management attention, and there can be no assurance that we will be able to successfully integrate acquired businesses into our operations. Additionally, we may not achieve the anticipated benefits from any acquisition.
9| December 27, 2025 Form 10-K | ||||||||
Unfavorable changes in the current economic environment may make it difficult to acquire businesses in order to further our growth strategy. We will continue to seek acquisition opportunities both to expand into new markets and to enhance our position in our existing markets. However, our ability to do so will depend on a number of factors, including our ability to obtain financing that we may need to complete a proposed acquisition opportunity which may be unavailable or available on terms that are not advantageous to us. If financing is unavailable or on unfavorable terms, we may be forced to forego otherwise attractive acquisition opportunities which may have a negative effect on our ability to grow.
Risks Related to our Operations:
Our business is subject to risks associated with sourcing product from overseas, including tariffs.
We import a majority of our products and rely on foreign sources, primarily China and Taiwan, to meet our supply demands at prices that support our current operating margins. Substantially all of our import operations are subject to customs requirements, tariffs, and quotas set by governments through mutual agreements or unilateral actions. The U.S. tariffs on steel, aluminum, and other imported goods have materially increased the costs of many of our foreign sourced products, and any escalation in the tariffs will increase the impact, including without limitation recent tariffs against goods imported from China, Mexico, and Canada enacted since February 1, 2025 by the Trump Administration and any retaliatory tariffs issued in response thereto.
In order to sustain current operating margins while the tariffs are in effect, we must be able to increase prices with our customers and find alternative, similarly priced sources that are not subject to the tariffs. If we are unable to effectively implement these countermeasures, our operating margins will be impacted.
In addition, the countries from which our products and materials are manufactured or imported may, from time to time, impose additional quotas, duties, tariffs, or other restrictions on their imports or adversely modify existing restrictions. Adverse changes in these import costs and restrictions, or our suppliers' failure to comply with customs regulations or similar laws, could harm our business.
We estimate we source approximately 33% of our products from China, 33% from suppliers based in North America, and 33% from all other countries. Based on the current facts and tariff environment as of the date of this filing, we expect the tariffs to continue to drive an increase in our net working capital and cost of sales. We have raised prices to offset the tariff costs, although these price increases could impact future demand for our products. We continue to analyze the impact of these actions and what, if any, steps, including pricing actions, we may take to mitigate the impact of the tariffs. Consistent with our normal course of business, we will continue exploring alternative suppliers in other countries to source quality products that provide the best value for our customers.
If any of our existing vendors fail to meet our needs, we believe that sufficient capacity exists in the open market to supply any shortfall that may result. However, it is not always possible to replace a vendor on short notice without disruption in our operations, which may require more costly expedited transportation expense and replacement of a major vendor is often at higher prices.
Our ability to import products in a timely and cost-effective manner may also be affected by conditions at ports or issues that otherwise affect transportation and warehousing providers, such as port and shipping capacity, high demand for ocean freight, labor disputes, hostilities or terrorism against ocean vessels or changes in shipping routes to avoid the same, severe weather, or increased homeland security requirements in the U.S. and other countries. These issues could delay importation of products, increase our transit costs, or require us to locate alternative ports or warehousing providers to avoid disruption to customers. These alternatives may not be available on short notice or could result in higher transit costs, which could have an adverse impact on our business and financial condition.
Additionally, in recent years, tensions between mainland China and Taiwan have further escalated. Conflict between China and Taiwan could disrupt our supply chain, including limiting access to key ports, disrupting the operations of our suppliers, or resulting in potential international sanctions, all of which could adversely affect our results of operations or increase our costs.
Our results of operations could be negatively impacted by inflation or deflation in supply chain costs, including raw materials, sourcing, transportation and energy.
Many of our products are manufactured out of metals, including but not limited to steel, aluminum, zinc, and copper. Additionally, we use other commodity-based materials in the manufacture of Letters, Numbers, and Signs (“LNS”) that are resin-based and subject to fluctuations in the price of oil. We source the majority of our products from third parties and are subject to changes in their underlying manufacturing costs. We also use third parties for transportation and are exposed to fluctuations in freight costs to transport goods from our suppliers to our distribution facilities and to our customers, as well as the price of diesel fuel in the form of freight surcharges on
10| December 27, 2025 Form 10-K | ||||||||
customer shipments and the cost of gasoline used by the field sales and service force. Inflation in these costs could result in significant cost increases. If we are unable to mitigate any cost increases from the foregoing factors through various customer pricing actions and cost reduction initiatives, our financial condition may be adversely affected. Conversely, in the event that there is deflation, we may experience, and in fact have experienced, pressure from our customers to reduce prices. There can be no assurance that we would be able to reduce our cost base (through negotiations with suppliers or other measures) to offset any such price concessions which could adversely impact our results of operations and cash flows.
We are subject to inventory management risks: insufficient inventory may result in increased costs, lost sales and lost customers, while excess inventory may increase our costs.
We balance the need to maintain inventory levels that are sufficient to maintain superior customer fulfillment levels against the risk and financial costs of carrying excess inventory levels. In order to successfully manage our inventories, we must estimate demand from our customers at the product level and timely purchase products in quantities that substantially correspond to that demand. If we overestimate demand and purchase too much of a particular product, we could have excess inventory handling costs, distribution center capacity constraints and inventory that we cannot sell profitably.
In addition, we may have to write down such inventory if we are unable to sell it for its recorded value. In fact, In the fourth quarter of 2023, we recorded inventory revaluation charges of $5.0 million in connection with exiting certain retail locations and markets for a product line. By contrast, if we underestimate demand and purchase insufficient quantities of a product, and/or do not maintain enough inventory of a product, we may not be able to fulfill customer orders on a timely basis which could result in fines, the loss of sales and ultimately loss of customers for those products as they turn to our competitors. Our business, financial condition and results of operations could suffer a material adverse effect if either or both of these situations occur frequently or in large volumes.
Because our business is working capital intensive, we rely on our ability to manage our product purchasing and customer credit policies.
Our operations are working capital intensive, and our inventories, accounts receivable, and accounts payable are significant components of our net asset base. We manage our inventories and accounts payable through our purchasing policies and our accounts receivable through our customer credit policies. During 2022, we saw increased lead times for ocean freight from Asia due to disruptions in the global supply chain, and we had to increase our inventory levels to maintain our high fill rates with our customers, which has increased our inventory costs and reduced our profitability. Our lead times and inventory levels normalized in 2023. However, there are no assurances that lead times will not increase in the future, and if we fail to adequately manage our product purchasing or customer credit policies, our working capital and financial condition may be adversely affected.
We are subject to the risks of doing business internationally.
A portion of our revenue is generated outside the United States, primarily from customers located in Canada, Mexico, Latin America, and the Caribbean. Because we sell our products and services outside the United States, our business is subject to risks associated with doing business internationally, which include:
•changes in a specific country's or region's political and cultural climate or economic condition;
•unexpected or unfavorable changes in foreign laws and regulatory requirements;
•difficulty of effective enforcement of contractual provisions in local jurisdictions;
•inadequate intellectual property protection in foreign countries;
•the imposition of duties and tariffs and other trade barriers, including without limitation recent tariffs against goods imported from China, Mexico, and Canada since February 1, 2025 by the Trump Administration and any retaliatory tariffs issued in response thereto;
•trade-protection measures, import or export licensing requirements such as Export Administration Regulations promulgated by the U.S. Department of Commerce, Economic Sanctions Laws and Regulations administered by the Office of Foreign Assets Control, and fines, penalties, or suspension or revocation of export privileges;
•violations of the United States Foreign Corrupt Practices Act;
•the effects of applicable and potentially adverse foreign tax law changes;
•significant adverse changes in foreign currency exchange rates; and
•difficulties associated with repatriating cash in a tax-efficient manner.
11| December 27, 2025 Form 10-K | ||||||||
Any failure to adapt to these or other changing conditions in foreign countries in which we do business could have an adverse effect on our business and financial results.
Risks Related to our Workforce:
Successful sales and marketing efforts depend on our ability to recruit and retain qualified employees.
The success of our efforts to grow our business depends on the contributions and abilities of key executives, our sales force, and other personnel, including the ability of our sales force to achieve adequate customer coverage. We must therefore continue to recruit, retain, and motivate management, sales, and other personnel to maintain our current business and to support our projected growth. A shortage of these key employees might jeopardize our ability to implement our growth strategy.
Increases in labor costs, potential labor disputes and work stoppages or an inability to hire skilled distribution, sales and other personnel could adversely affect our business.
An increase in labor costs, work stoppages or disruptions at our facilities or those of our suppliers or transportation service providers, or other labor disruptions, could decrease our sales and increase our expenses. In addition, although our employees are not represented by a union, our labor force may become subject to labor union organizing efforts, which could cause us to incur additional labor costs and increase the related risks that we now face.
A significant increase in the salaries and wages paid by competing employers could result in a reduction of our labor force, increases in the salaries and wages that we must pay, or both. If we are unable to hire warehouse, distribution, sales and other personnel, our ability to execute our business plan and our results of operations would suffer.
Risks Related to our Technology and Cybersecurity:
Our success is highly dependent on information and our technology systems, as well as those of our third party vendors and business partners.
We depend on our information systems, and those of our third party vendors and business partners, to process orders, to manage inventory and accounts receivable collections, to purchase, sell, and ship products efficiently and on a timely basis, to maintain cost-effective operations, and to provide superior service to our customers. If these systems are damaged, intruded upon, shutdown, or cease to function properly (whether by planned upgrades, force majeure, telecommunications failures, hardware or software break-ins or viruses, other cyber-security incidents, or otherwise), we may suffer disruption in our ability to manage and operate our business.
In late May 2023, we experienced a ransomware attack relating to certain systems on our network (the “Cybersecurity Incident”). The Cybersecurity Incident affected certain of our information technology systems, and as part of the containment effort, we suspended affected systems and elected to temporarily suspend additional systems in an abundance of caution. We reactivated and restored our operational systems over the course of the week following the Cybersecurity Incident.
While we have taken measures designed to protect the security of our information and technology systems, and any information handled by these systems, including personal, sensitive, confidential, and proprietary information, there can be no assurance that the measures which we have adopted to protect against certain events that could disrupt the operations of our information systems will prevent the occurrence of such a disruption. Any such disruption could have a material adverse effect on our business and results of operations.
In addition, we plan to upgrade our existing information technology systems or choose to incorporate new technology systems from time to time in order for such systems to support our business. Costs and potential problems and interruptions associated with the implementation of new or upgraded systems and technology or with maintenance or adequate support of existing systems could disrupt or reduce the efficiency of our operations. Any such reduction in efficiency or disruption could have a material adverse effect on our business and results of operations.
Complications with the design or implementation of our new enterprise resource planning ("ERP") system could adversely impact our business and operations.
We rely on various information systems and technology to manage our business. We are in the process of a multi-year implementation of a new ERP system. We expect the first phase of this project to be operationalized in mid
12| December 27, 2025 Form 10-K | ||||||||
2026, with future phases to follow. This ERP system is designed to accurately maintain the Company’s financial records, enhance operational functionality, provide timely information to the Company’s management team related to the operation of the business, and streamline internal controls over financial reporting. The ERP system implementation process has required, and will continue to require, the investment of significant personnel and financial resources. We may not be able to successfully complete the implementation efforts without experiencing delays, increased costs, and other difficulties. Any reduction in efficiency or disruption could have a material adverse effect on our business and results of operations. If we are unable to successfully manage implementation efforts related to our new ERP system, our financial positions, results of operations and cash flows could be negatively impacted. Further, if the ERP system does not operate as intended, the effectiveness of our internal control over financial reporting could be adversely impacted.
Unauthorized disclosure of personal, sensitive or confidential customer, employee, supplier, or Company information, whether through a breach of our computer systems, or those of our third party vendors and business partners, including cyber-attacks or otherwise, could severely harm our business.
As part of our business, we collect, process, and retain personal, sensitive and confidential personal information about our customers, employees, and suppliers. Despite the security measures we have in place, our facilities and systems, and those of the retailers and other third party distributors with which we do business, may be vulnerable to security breaches, cyber-attacks, acts of vandalism, computer viruses, misplaced or lost data, programming and/or human errors, or other similar events. In fact, in late May 2023, we experienced a ransomware attack relating to certain systems on our network, as is more fully described on the preceding page, and some confidential personal information of our employees and selected dependents was accessed by the threat actor.
In addition, employees may intentionally or inadvertently cause the unauthorized access to or release of personal, sensitive, or confidential customer, employee, supplier or Company information. Because the techniques used to circumvent security systems can be highly sophisticated, change frequently, are often not recognized until launched against a target, and may originate from less regulated and remote areas around the world, we may be unable to proactively anticipate or address all possible techniques or implement adequate preventive measures for all situations.
Any security breach involving the misappropriation, loss, or other unauthorized disclosure of confidential customer, employee, supplier, or Company information, whether by us or by the retailers and other third party distributors and business partners with which we do business, could result in losses, severely damage our reputation, expose us to the risks of litigation and liability, disrupt our operations, and have a material adverse effect on our business, results of operations, and financial condition.
We anticipate that these threats will continue to grow in scope and complexity over time. Cybercrime and attacking techniques are constantly evolving, and we or our third party vendors and business partners may be unable to anticipate attempted security breaches, react in a timely manner, or implement adequate preventative measures, particularly given the increasing use of hacking techniques designed to circumvent controls, avoid detection, and remove or obfuscate forensic artifacts.
The regulatory environment related to information security, data collection, and privacy is increasingly rigorous, with new and constantly changing requirements applicable to our business, and compliance with those requirements could result in additional costs. As a result, our practices may not have complied in the past or may not comply now or in the future with all such laws, regulations, requirements and obligations. Our failure to take any steps perceived by the regulatory body as appropriate to protect certain information may result in claims under various data privacy and security laws, which could severely impact our business.
Risks Related to Intellectual Property:
Failure to adequately protect intellectual property could adversely affect our business.
Intellectual property rights are an important and integral component of our business. We attempt to protect our intellectual property rights through a combination of patent, trademark, copyright, and trade secret laws, as well as licensing agreements and third-party nondisclosure and assignment agreements.
In the event that our trademarks or patents are successfully challenged and we lose the rights to use those trademarks or patents, or if we fail to prevent others from using them, we could experience reduced sales or be forced to redesign or rebrand our products, requiring us to devote resources to product development, advertising, and marketing new products and brands. In addition, we cannot be sure that any pending trademark or patent applications will be granted or will not be challenged or opposed by third parties or that we will be able to enforce our trademark rights against counterfeiters.
13| December 27, 2025 Form 10-K | ||||||||
Failure to obtain or maintain adequate protection of our intellectual property rights for any reason could have a material adverse effect on our business, results of operations, and financial condition.
Our success depends in part on our ability to operate without infringing on or misappropriating the proprietary rights of others, and if we are unable to do so we may be liable for damages.
We cannot be certain that United States or foreign patents or patent applications of other companies do not exist or will not be issued that would prevent us from commercializing our products. Third parties may sue us, and in fact have sued us (see Item 3 - Legal Proceedings of this Annual Report and Note 15 - Commitments and Contingencies of the Notes to Consolidated Financial Statements for additional information), for infringing or misappropriating their patent or other intellectual property rights. Intellectual property litigation is costly. If we do not prevail in litigation, in addition to any damages we might have to pay, we could be required to cease the infringing activity, obtain a license requiring us to make royalty payments, and/or enter into other settlement arrangements that temporarily preclude us from liability. It is possible that a required license may not be available to us on commercially acceptable terms, if at all. In addition, a required license may be non-exclusive, and therefore our competitors may have access to the same technology licensed to us. If we fail to obtain a required license or are unable to design around another company’s patent, we may be unable to make use of some of the affected products, which would reduce our revenue.
The defense costs and settlements for patent infringement lawsuits are not covered by insurance. Patent infringement lawsuits can take years to settle. If we are not successful in our defenses or are not successful in obtaining dismissals of any such lawsuit, legal fees or settlement costs could have a material adverse effect on our results of operations and financial position.
Risks Relating to Our Indebtedness:
We have significant indebtedness that could affect operations and financial condition and prevent us from successfully executing our strategy.
We have a significant amount of indebtedness. On December 27, 2025, our total indebtedness was $693.1 million, of which, $637.0 million is indebtedness issued under the term loan facility, and $20.1 million is indebtedness under finance lease and other obligations. The Company also has an asset-based revolving credit facility with aggregate commitments of up to $375.0 million, an outstanding balance of $36.0 million, and aggregate availability of $279.1 million as of December 27, 2025, subject to customary asset-backed loan borrowing base and availability provisions.
Our substantial indebtedness could have important consequences. For example, it could:
•make it more difficult for us to satisfy obligations to holders of our indebtedness;
•increase our vulnerability to increases in interest rates;
•increase our vulnerability to general adverse economic and industry conditions;
•require the dedication of a substantial portion of cash flow from operations to payments on indebtedness, thereby reducing the availability of cash flow to fund working capital, capital expenditures, research and development efforts, and other general corporate purposes;
•limit flexibility in planning for, or reacting to, changes in our business and the industry in which we operate;
•place us at a competitive disadvantage compared to competitors that have less debt; and
•limit our ability to borrow additional funds.
In addition, the agreement governing our senior secured credit facilities contain financial and other restrictive covenants that limit our ability to engage in activities that may be in our long-term best interests. The failure to comply with those covenants could result in an event of default which, if not cured or waived, could result in the acceleration of all outstanding indebtedness.
Despite current indebtedness levels, we may still be able to incur substantially more debt. This could further exacerbate the risks associated with our substantial leverage.
We may be able to incur substantial additional indebtedness in the future. The terms of our senior secured credit facilities do not fully prohibit us from doing so. The senior secured credit facilities permit additional borrowing of up to $279.1 million as of December 27, 2025, subject to customary asset-backed loan borrowing base and availability provisions. If new debt is added to our current debt levels, the related risks that we now face could intensify.
14| December 27, 2025 Form 10-K | ||||||||
We rely on available borrowings under the Asset-Based Revolving credit facility (“ABL Revolver”) for cash to operate our business, and the availability of credit under the ABL Revolver may be subject to significant fluctuation.
In addition to cash we generate from our business, our principal existing source of cash is borrowings available under the ABL Revolver. Aggregate availability will be limited to the lesser of a borrowing base and $375.0 million. The borrowing base is calculated on a monthly (or more frequent under certain circumstances) valuation of our inventory, accounts receivable and certain cash balances. As a result, our access to credit under the ABL Revolver is potentially subject to significant fluctuation, depending on the value of the borrowing base-eligible assets as of any measurement date. The inability to borrow under the ABL Revolver may adversely affect our liquidity, financial position and results of operations. As of December 27, 2025, the ABL Revolver had an outstanding balance of $36.0 million and had outstanding letters of credit of $3.3 million, with $279.1 million of available borrowings as a source of liquidity based on the customary asset-backed loan borrowing base and availability provisions.
We are subject to fluctuations in interest rates.
All of our indebtedness incurred under our senior secured credit facilities have variable interest rates. Increases in borrowing rates will increase our cost of borrowing, which may adversely affect our results of operations and financial condition. Our term loan and interest rate derivatives generally bear interest at a rate per annum equal to Daily Simple Secured Overnight Financing Rate (SOFR). We may, and have in the past, enter into interest rate derivatives that hedge risks related to floating for fixed rate interest payments in order to reduce interest rate volatility, however there are no assurances that we will do so, or that we will be able to do so on terms favorable to us. Further, we may choose not to maintain interest rate swaps with any of our variable rate indebtedness, or may only choose to maintain interest rate swaps with some, but not all, of our variable rate indebtedness.
The failure to meet certain financial covenants required by our credit agreements may materially and adversely affect assets, financial position, and cash flows.
Certain aspects of our credit agreements require the maintenance of a leverage ratio and limit our ability to incur debt, make investments, or undertake certain other business activities. In particular, our minimum allowed fixed charge coverage ratio requirement is 1.0x as of December 27, 2025. A breach of the covenant, or any other covenants, could result in an event of default under the credit agreements. Upon the occurrence of an event of default under the credit agreements, all amounts outstanding, together with accrued interest, could be declared immediately due and payable by our lenders. If this happens, our assets may not be sufficient to repay in full the payments due under the credit agreements. The current credit market environment and other macro-economic challenges affecting the global economy may adversely impact our ability to borrow sufficient funds or sell assets or equity in order to pay existing debt.
Volatility and weakness in bank and capital markets may adversely affect credit availability and related financing costs for us.
Bank and capital markets can experience periods of volatility and disruption. If the disruption in these markets is prolonged, our ability to refinance, and the related cost of refinancing, some or all of our debt could be adversely affected. Additionally, during periods of volatile credit markets, there is a risk that lenders, even those with strong balance sheets and sound lending practices, could fail or refuse to honor their legal commitments and obligations under existing credit commitments. Although we currently can access the bank and capital markets, there is no assurance that such markets will continue to be a reliable source of financing for us. These factors, including the tightening of credit markets, could adversely affect our ability to obtain cost-effective financing.
Increased volatility and disruptions in the financial markets also could make it more difficult and more expensive for us to refinance outstanding indebtedness and obtain financing. In addition, the adoption of new statutes and regulations, the implementation of recently enacted laws or new interpretations or the enforcement of older laws and regulations applicable to the financial markets or the financial services industry could result in a reduction in the amount of available credit or an increase in the cost of credit. Disruptions in the financial markets can also adversely affect our lenders, insurers, customers, and other counterparties. Any of these results could cause a material adverse effect to our business, financial condition, and results of operations.
Legal, Regulatory, and Other External Risks:
We are exposed to adverse changes in currency exchange rates.
Exposure to foreign currency risk exists because we, through our global operations, enter into transactions and make investments denominated in multiple currencies. Our predominant exposures are in Canadian, Mexican, and
15| December 27, 2025 Form 10-K | ||||||||
Asian currencies, including the Chinese Yuan (“CNY”). In preparing our Consolidated Financial Statements for foreign operations with functional currencies other than the U.S. dollar, asset and liability accounts are translated at current exchange rates and income and expenses are translated using weighted-average exchange rates. With respect to the effects on translated earnings, if the U.S. dollar strengthens relative to local currencies, our earnings could be negatively impacted. We do not make a practice of hedging our non-U.S. dollar earnings.
We source many products from China and other Asian countries for resale in other regions. To the extent that the U.S. dollar declines relative to the CNY or other currencies, we may experience cost increases on such purchases. The U.S. dollar decreased in value relative to the CNY by 4.0% in 2025, increased by 2.8% in 2024 and increased by 2.9% in 2023. Significant appreciation of the CNY or other currencies in countries where we source our products could adversely impact our profitability. In addition, our foreign subsidiaries in Canada and Mexico may purchase certain products from their vendors denominated in U.S. dollars. If the U.S. dollar strengthens compared to the local currencies, it may result in margin erosion. We have a practice of hedging some of our Canadian subsidiary's purchases denominated in U.S. dollars. We may not be successful at implementing customer pricing or other actions in an effort to mitigate the related cost increases which may adversely impact our results of operations.
If we were required to write down all or part of our goodwill or indefinite-lived trade names, our financial condition and results of operations could be materially adversely affected.
We have $830.7 million of goodwill and $85.3 million of indefinite-lived trademarks recorded on our accompanying Consolidated Balance Sheets at December 27, 2025. We are required to periodically determine if our goodwill or indefinite-lived trademarks have become impaired, in which case we would write down the impaired portion.
If we were required to record additional write downs of all or part of our goodwill or indefinite-lived trademarks, our financial condition and net income could be materially adversely affected.
We are subject to legal proceedings and legal compliance risks.
We are involved in various legal proceedings, which from time to time may involve lawsuits, state and federal governmental inquiries, audits and investigations, environmental matters, employment, tort, state false claims act, consumer litigation, and intellectual property litigation. At times, such matters may involve executive officers and other management. Certain of these legal proceedings may be a significant distraction to management and could expose us to significant liability, including settlement expenses, damages, fines, penalties, attorneys' fees and costs, and non-monetary sanctions, any of which could have a material adverse effect on our business and results of operations.
Our business may be adversely affected by seasonality.
In general, we have experienced seasonal fluctuations in sales and operating results from quarter to quarter. Typically, the first calendar quarter is the weakest due to the effect of weather on home projects and the construction industry. If adverse weather conditions persist on a regional or national basis into the second or other calendar quarters, our business, financial condition, and results of operations may be materially adversely affected.
Future tax law changes may materially increase our prospective income tax expense.
We are subject to income taxation in many jurisdictions in the U.S., as well as foreign jurisdictions. Judgment is required in determining our worldwide income tax provision and, accordingly, there are many transactions and computations for which our final income tax determination is uncertain. We are occasionally audited by income tax authorities in various tax jurisdictions. Although we believe our recorded tax estimates are reasonable, the ultimate outcome from any audit (or related litigation) could be materially different from the amounts reflected in our income tax provisions and accruals. Future settlements of income tax audits may have a material effect on earnings between the period of initial recognition of tax estimates in the financial statements and the point of ultimate tax audit settlement.
Additionally, it is possible that future income tax legislation and regulations or interpretations thereof in any jurisdiction to which we are subject to taxation may be enacted and such changes could have a material impact on our worldwide income tax provision beginning with the period during which such changes become effective. In addition, our future effective tax rates could be subject to volatility or adversely affected by a number of factors, including:
•changes in the valuation of our deferred tax assets and liabilities;
•expected timing and amount of the release of any tax valuation allowances;
•tax effects of stock-based compensation;
16| December 27, 2025 Form 10-K | ||||||||
•costs related to intercompany restructurings; and
•lower than anticipated future earnings in jurisdictions where we have lower statutory tax rates and higher than anticipated future earnings in jurisdictions where we have higher statutory tax rates.
| ITEM 1B - UNRESOLVED STAFF COMMENTS. | ||
None.
ITEM 1C - CYBERSECURITY. | ||
Cybersecurity Risk Management and Strategy
The Company’s cybersecurity policies, standards, processes, and practices for assessing, identifying and managing material risks from cybersecurity threats and responding to cybersecurity incidents are part of the Company’s overall risk assessment efforts. The Company has established controls and procedures, including an incidence response plan, that provide for the identification, notification, escalation, communication, and remediation of data security incidents at appropriate levels so that decisions regarding the public disclosure and reporting of such incidents can be made by management in a timely manner. The Company continues to review its Cybersecurity program and controls and procedures as part of its efforts to strengthen its defenses.
Role of the Board of Directors
Role of Management
The cybersecurity team includes dedicated internal resources that currently have Certified Information Systems Security Professional ("CISSP") credentials, Certificate of Cloud Security Knowledge ("CCSK"), and other security and network certifications. In addition to our internal security staff, we partner with various third-party security service providers to augment our staffing, expertise, and hours of operation.
The cybersecurity team leverages tools and systems such as Security Information and Event Management ("SIEM"), for real time alerts and insights.
The SVP-IT regularly reports to our senior leadership team, as well as periodically to our Board of Directors , regarding our cybersecurity program and material cybersecurity risks. The SVP-IT coordinates with other teams including internal Audit, to ensure a combined focus on technology modernization and remediation needs. The
17| December 27, 2025 Form 10-K | ||||||||
SVP-IT is briefed weekly on current security operations and relevant issues across the cybersecurity threat landscape.
Current Cybersecurity Events
In late May 2023, we experienced a ransomware attack relating to certain systems on our network (the “Cybersecurity Incident”). We promptly initiated an investigation, engaged the services of cybersecurity experts and outside advisors and worked with appropriate law enforcement authorities to contain, assess and remediate the Cybersecurity Incident.
The Cybersecurity Incident affected certain of our information technology systems, and as part of the containment effort, we suspended affected systems and elected to temporarily suspend additional systems in an abundance of caution. We reactivated and restored our operational systems over the course of the week following the Cybersecurity Incident. In 2023, the Cybersecurity Incident related costs net of an expected insurance receivable totaled $1.0 million. Our system remediation efforts regarding the Cybersecurity Incident were concluded as of December 30, 2023. In the fourth quarter of 2024, we received proceeds from our insurance claim that exceeded the amount recorded as a receivable by $0.6 million. These proceeds represented the cost associated with lost revenue and incremental expenses incurred.
18| December 27, 2025 Form 10-K | ||||||||
| ITEM 2 – PROPERTIES. | ||
As of December 27, 2025, our principal office, manufacturing, and distribution properties were as follows:
| Business Segment | Approximate Square Footage | Description | ||||||||||||
| Hardware and Protective Solutions & Robotics and Digital Solutions | ||||||||||||||
| Belton, Missouri | 305,000 | Distribution | ||||||||||||
| Cincinnati, Ohio | 270,000 | Office, Distribution | ||||||||||||
| Dallas, Texas | 166,000 | Distribution | ||||||||||||
Forest Park, Ohio (1) | 428,000 | Office, Distribution | ||||||||||||
| Jacksonville, Florida | 193,000 | Distribution | ||||||||||||
| Jonestown, Pennsylvania | 187,000 | Distribution | ||||||||||||
| Shafter, California | 168,000 | Distribution | ||||||||||||
| Tempe, Arizona | 184,000 | Office, Mfg., Distribution | ||||||||||||
| Hardware and Protective Solutions | ||||||||||||||
| Atlanta, Georgia | 14,000 | Office | ||||||||||||
| Guadalajara, Mexico | 12,000 | Office, Distribution | ||||||||||||
| Pompano Beach, Florida | 39,000 | Office, Distribution | ||||||||||||
| Monterrey, Mexico | 13,000 | Distribution | ||||||||||||
| Shannon, Georgia | 421,000 | Office, Mfg., Distribution | ||||||||||||
| Hamilton, Ohio | 58,000 | Mfg., Distribution | ||||||||||||
| Salem, Oregon | 31,000 | Distribution | ||||||||||||
Tyler, Texas (2) | 202,000 | Office, Mfg., Distribution | ||||||||||||
| Villa Rica, Georgia | 275,000 | Office, Mfg., Distribution | ||||||||||||
| Shakopee, Minnesota | 168,000 | Office, Distribution | ||||||||||||
| Golden Valley, Minnesota | 4,400 | Office | ||||||||||||
| Robotics and Digital Solutions | ||||||||||||||
| Boulder, Colorado | 8,000 | Office | ||||||||||||
| Canada | ||||||||||||||
| Burnaby, British Columbia | 29,000 | Distribution | ||||||||||||
| Edmonton, Alberta | 100,000 | Distribution | ||||||||||||
| Laval, Quebec | 34,000 | Distribution | ||||||||||||
| Scarborough, Ontario | 23,000 | Mfg., Distribution | ||||||||||||
| Toronto, Ontario | 456,000 | Office, Distribution | ||||||||||||
| Winnipeg, Manitoba | 42,000 | Distribution | ||||||||||||
(1)The Company leases two facilities in Forest Park, Ohio. This first is the Company's 43,000 square foot corporate office headquarters located at 1280 Kemper Meadow Road. The second is a 385,000 square foot distribution center located at 1700 Carillon Boulevard.
(2)The Company leases two facilities in Tyler, Texas. The first is a 139,000 square foot facility located at 2329 E. Commerce Street used for manufacturing and distribution. The second is a 63,000 square foot facility located at 6357 Reynolds Road used for offices, manufacturing, and distribution.
All of the Company's facilities are leased. In the opinion of the Company's management, the Company's existing facilities are in good condition.
19| December 27, 2025 Form 10-K | ||||||||
| ITEM 3 - LEGAL PROCEEDINGS. | ||
We are subject to various claims and litigation that arise in the normal course of business. For a description of our material legal proceedings, see Note 15 - Commitments and Contingencies of the Notes to Consolidated Financial Statements included in this Annual Report on Form 10-K.
Dispute with Kiosk Development Partner
On December 16, 2024, the Company entered into a settlement agreement with a kiosk development partner (the “Kiosk Partner”), pursuant to which the Company paid the Kiosk Partner a $5 million settlement on December 30, 2024 to resolve all claims and disputes alleged by the Kiosk Partner. The Kiosk Partner’s claims alleged that, among other things, the Company failed to pay certain per key royalty fees to the Kiosk Partner allegedly owed under a joint development agreement dating back over 10 years ago. Though the Company believes it had strong defenses to the claims made by the Kiosk Partner, the Company opted to settle the matter before litigation was filed in order to avoid the cost and uncertainty of protracted litigation.
| ITEM 4 – MINE SAFETY DISCLOSURES. | ||
Not Applicable.
| PART II | ||||||||||||||
| ITEM 5 – MARKET FOR REGISTRANT'S COMMON EQUITY, RELATED STOCKHOLDER MATTERS AND ISSUER PURCHASES OF EQUITY SECURITIES. | ||
Common Stock Data
The Company's common stock is traded on The Nasdaq Stock Market under the symbol 'HLMN'. There were approximately 18 holders of record of common stock as of February 12, 2026. In addition to holders of record of our common stock, there is a substantially greater number of “street name” holders or beneficial holders whose Class A common stock is held of record by banks, brokers and other financial institutions.
Dividends
The Company has never declared or paid cash dividends on its common stock and has no intention to do so in the foreseeable future.
Securities Authorized for Issuance Under Equity Compensation Plans
See Part III, Item 12 of this Form 10-K and Note 11 - Stock-Based Compensation of the Notes to Consolidated Financial Statements included herein for additional information.
20| December 27, 2025 Form 10-K | ||||||||
Stock Price Performance
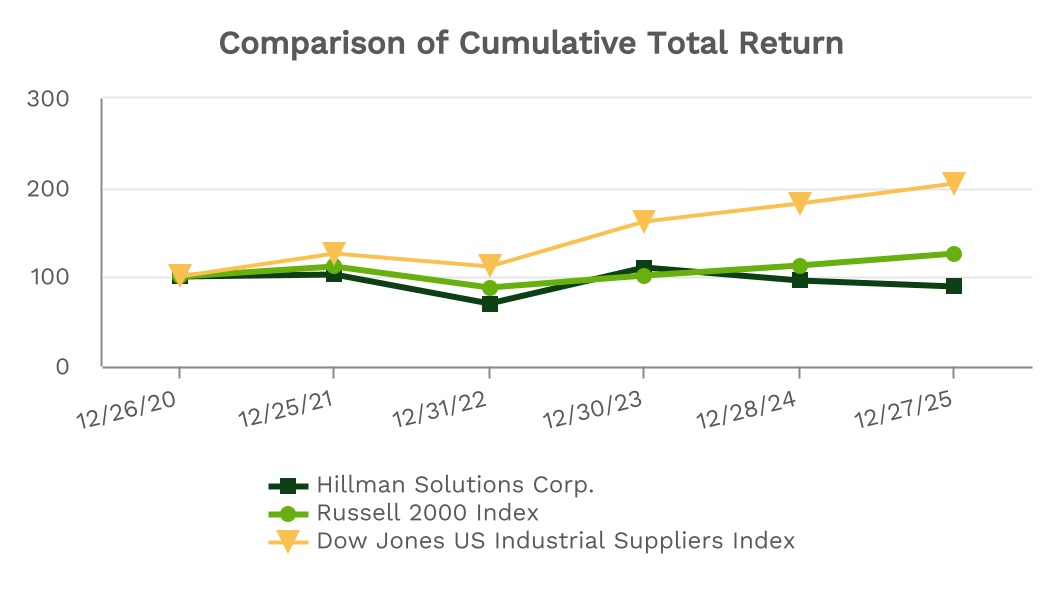
| December 26, 2020 | December 25, 2021 | December 31, 2022 | December 30, 2023 | December 28, 2024 | December 27, 2025 | |||||||||||||||
| Hillman Solutions Corp. | 100.0 | 102.5 | 70.4 | 110.1 | 95.7 | 88.8 | ||||||||||||||
| Russell 2000 Index | 100.0 | 111.9 | 87.9 | 101.2 | 112.0 | 126.5 | ||||||||||||||
| Dow Jones US Industrial Suppliers Index | 100.0 | 126.4 | 110.9 | 161.9 | 182.5 | 204.8 | ||||||||||||||
The graph above compares the cumulative total stockholder return on our Class A common stock with the cumulative total return on the Russell 2000 Index and the Dow Jones US Industrial Suppliers Index. The graph assumes an initial investment of $100 in our common stock at the market close on the last trading day of our fiscal year ended December 26, 2020, and the points on the graph represent the value on the last trading day of each of our last 5 fiscal years. Data for the Russell 2000 Index and the Dow Jones US Industrial Suppliers Index assume reinvestment of dividends. Total return equals stock price appreciation plus reinvestment of dividends.
Unregistered Sales of Equity Securities
We did not issue or sell any unregistered equity securities during the year ended December 27, 2025.
Issuer Purchases of Equity Securities
The following table presents the number and average price of shares purchased in each fiscal month of the fourth quarter of fiscal 2025, all of which were completed through open market purchases (shares in whole numbers, dollars in thousands):
| Period | Total Number of Shares Purchased (1) | Average Price Paid Per Share | Total Number of Shares Purchased as Part of Publicly Announced Plan | Approximate Dollar Value of Shares that May Yet Be Purchased Under the Plan(1)(2) | ||||||||||||||||||||||
September 28, 2025 - October 25, 2025 | 205,061 | $ | 9.29 | 530,645 | $ | 94,926 | ||||||||||||||||||||
October 26, 2025 - November 22, 2025 | 471,196 | $ | 8.61 | 1,001,841 | $ | 90,870 | ||||||||||||||||||||
November 23, 2025 - December 27, 2025 | 367,727 | $ | 8.95 | 1,369,568 | $ | 87,577 | ||||||||||||||||||||
| 1,043,984 | $ | 8.86 | 1,369,568 | |||||||||||||||||||||||
(1)On July 31, 2025, the Board of Directors of the Company authorized a share repurchase program of up to $100,000. The July 2025 authorization does not have a prescribed expiration date.
(2)Excludes excise taxes incurred on share repurchases.
21| December 27, 2025 Form 10-K | ||||||||
| ITEM 6 – [RESERVED] | ||
| ITEM 7 – MANAGEMENT'S DISCUSSION AND ANALYSIS OF FINANCIAL CONDITION AND RESULTS OF OPERATIONS. | ||
The following discussion provides information which our management believes is relevant to an assessment and understanding of our operations and financial condition. This discussion should be read in conjunction with the Consolidated Financial Statements and Notes to Consolidated Financial Statements and schedules thereto appearing elsewhere herein. In addition, see “Safe Harbor Statement under the Private Securities Litigation Reform Act of 1995 Regarding Forward-Looking Information”, as well as “Risk Factors” in Item 1A of this Annual Report.
Executive Overview and Trends in our Business
Net sales during 2025 increased by 5.4% when compared to 2024. Driving our performance for the year was the net sales contributions from new business wins, along with the contribution of net sales from the Intex DIY acquisition, which closed in August 2024, and the contribution of price increases, which were implemented during the year to offset an increase in costs related to tariffs. These contributions to net sales were offset by the soft home improvement market during the year. Hardware and Protective Solutions, our largest segment making up 76.9% of our net sales, led the way with an increase of 7.8%, while our Robotics and Digital Solutions segment returned to growth during 2025 contributing 1.6%. Partially offsetting this growth was a decline in our Canadian business segment.
Products across our business are primarily used by DIYers and professionals shopping at our customers' retail locations for repair, maintenance, and remodel projects. Because repair and maintenance projects are beneficial and often necessary no matter the economic environment, we believe our business is generally resilient to economic downturns. However, remodel projects are more dependent upon macroeconomic variables, including existing home sales. According to the National Association of Realtors, existing home sales in the U.S. for 2025 were unchanged from 2024, which marked a 30-year low, totaling 4.1 million. This was a headwind for our top line results during the year.
Our competitive moat, which consists of our 1,200 member field sales and service team, our ability to ship direct to the retail locations of our customers rather than their distribution network, and our 60+ years of experience set us apart from the competition. As such, we launched multiple new business wins during the year and we won vendor of the year awards from Do It Best and Home Depot Canada. We continue to focus on taking great care of our customers which has been a key focus on the company for over 60-years.
We are pleased with our top and bottom line results during 2025, as both were records for Hillman. Producing record top and bottom line results while successfully managing the dynamic and complex tariff situation is a testament to our team. Looking to 2026, we remain committed to driving value for our stakeholders, taking great care of our customers, and continuing to grow our business.
Impact of Global Economic Conditions on our Results of Operation
Our business is impacted by general economic conditions in the North American and international markets, particularly the U.S. and Canadian retail markets including hardware stores, home centers, mass merchants, and other retailers. Changes in current economic conditions, including inflationary pressures in the cost of inventory, transportation, and employee compensation, foreign currency volatility, and interest rates, have impacted consumer discretionary income levels and spending. Consumer discretionary income levels and spending impact the purchasing trends of our products by our retail customers. Any adverse trends in discretionary income and consumer spending could have a material adverse effect on our business or operating results.
We are exposed to the risk of unfavorable changes in foreign currency exchange rates for the U.S. dollar versus local currency of our suppliers located primarily in China and Taiwan. We purchase a majority of our products for resale from multiple vendors located in China and Taiwan. The purchase price of these products is routinely negotiated in U.S. dollar amounts rather than the local currency of the vendors and our suppliers' profit margins
22| December 27, 2025 Form 10-K | ||||||||
decrease when the U.S. dollar declines in value relative to the local currency. This puts pressure on our suppliers to increase prices to us. The U.S. dollar decreased in value relative to the CNY by approximately by 4.0% in 2025, increased by 2.8% in 2024, and increased by 2.9% in 2023. The U.S. dollar decreased in value relative to the Taiwan dollar by approximately 4.2% in 2025, increased by 7.1% in 2024, and decreased by 0.4% in 2023.
In addition, the negotiated purchase price of our products may be dependent upon market fluctuations in the cost of raw materials such as steel, zinc, and nickel used by our vendors in their manufacturing processes. The final purchase cost of our products may also be dependent upon inflation or deflation in the local economies of vendors in China and Taiwan that could impact the cost of labor and energy used in the manufacturing of our products. We identify the directional impact of changes in our product cost, but the quantification of each of these variable impacts cannot be measured as to the individual impact on our product cost with a sufficient level of precision. We may take pricing action, when warranted, in an attempt to offset a portion of product cost increases. The ability of our operating divisions to implement price increases and seek price concessions, as appropriate, is dependent on competitive market conditions.
We are also exposed to risk of unfavorable changes in the Canadian dollar exchange rate versus the U.S. dollar. Our sales in Canada are denominated in Canadian dollars while a majority of the products are sourced in U.S. dollars. A weakening of the Canadian dollar versus the U.S. dollar results in lower sales in terms of U.S. dollars while the cost of sales remains unchanged. We have a practice of hedging some of our Canadian subsidiary's purchases denominated in U.S. dollars. The U.S. dollar decreased in value relative to the Canadian dollar by approximately 5.2% in 2025, increased by 9.0% in 2024, and decreased by 2.4% in 2023.
We import products which are subject to customs requirements and to tariffs and quotas set by governments through mutual agreements and bilateral actions. U.S. tariffs on steel and aluminum and other imported goods has increased our product costs and required us to increase prices on the affected products. Recent tariffs against goods imported from China, Mexico, and Canada enacted since February 1, 2025 by the Trump Administration and any retaliatory tariffs issued in response thereto, have also caused us to increase prices on affected products.
Recent developments
Tariff Environment
In 2025, the U.S. government announced tariffs on imports from countries from which we import products and components. Additionally, other countries have announced their own tariffs. We estimate we source approximately 33% of our products from China, 33% from suppliers based in North America, and 33% from all other countries. Tariffs have resulted in an increase in our net working capital and cost of sales. We have raised our prices to offset the tariff costs, although these price increases could impact future demand for our products. We continue to analyze the impact of these actions and what, if any, steps, including pricing actions, we may take to mitigate the impact of the tariffs. Consistent with our normal course of business, we will continue exploring alternative suppliers in other countries to source quality products that provide the best value for our customers.
Segment Realignment
In the second quarter of 2025, the Company realigned its Hardware and Protective Solutions segment to include the sales of accessories, which are now managed by the Hardware and Protective Solutions leadership team. Previously, accessories were included under the Robotics and Digital Solutions segment leadership team. See Note 18 - Segment Reporting and Geographic Information of the Notes to Consolidated Financial Statements for additional information.
Share Repurchases
On July 31, 2025, the Board of Directors of the Company authorized a share repurchase program of up to $100.0 million (the “Repurchase Program”) of the Company's common stock. The company has repurchased a total of 1.4 million shares for $12.4 million as of December 27, 2025. See Note 10 - Equity and Accumulated Other Comprehensive Loss of the Notes to Consolidated Financial Statements for additional information.
Financial Summary and Other Key Metrics
Fiscal 2025 and 2024 consisted of 252 shipping days. Shipping days are defined as non-holiday week-days, Monday through Friday of each week of the fiscal year.
•Net sales for the year ended December 27, 2025 were $1,552.2 million compared to net sales of $1,472.6 million for the year ended December 28, 2024, an increase of approximately $79.6 million or 5.4%.
23| December 27, 2025 Form 10-K | ||||||||
•Net income improved to $40.3 million, or $0.20 per diluted share, compared to net income of $17.3 million, or $0.09 per diluted share for the year ended December 28, 2024.
•Adjusted EBITDA(1) totaled $275.3 million versus $241.8 million in the year ended December 28, 2024.
(1) Adjusted EBITDA is a non-GAAP financial measure. Refer to the “Non-GAAP Financial Measures” section for additional information, including our definition and our use of Adjusted EBITDA, and for a reconciliation from net income (loss) to Adjusted EBITDA.
Results of Operations
The following table shows the results of operations for the years ended December 27, 2025, December 28, 2024 and December 30, 2023.
| Year Ended December 27, 2025 | Year Ended December 28, 2024 | Year Ended December 30, 2023 | |||||||||||||||||||||||||||||||||
| (dollars in thousands) | Amount | % of Net Sales | Amount | % of Net Sales | Amount | % of Net Sales | |||||||||||||||||||||||||||||
| Net sales | $ | 1,552,224 | 100.0% | $ | 1,472,595 | 100.0% | $ | 1,476,477 | 100.0% | ||||||||||||||||||||||||||
| Cost of sales (exclusive of depreciation and amortization shown separately below) | 795,875 | 51.3% | 764,691 | 51.9% | 828,956 | 56.1% | |||||||||||||||||||||||||||||
| Selling, warehouse, general and administrative expenses | 502,000 | 32.3% | 488,702 | 33.2% | 452,110 | 30.6% | |||||||||||||||||||||||||||||
| Depreciation | 79,870 | 5.1% | 68,766 | 4.7% | 59,331 | 4.0% | |||||||||||||||||||||||||||||
| Amortization | 61,232 | 3.9% | 61,274 | 4.2% | 62,309 | 4.2% | |||||||||||||||||||||||||||||
| Other (income) expense, net | (722) | —% | 361 | —% | 12,843 | 0.9% | |||||||||||||||||||||||||||||
| Income from operations | 113,969 | 7.3% | 88,801 | 6.0% | 60,928 | 4.1% | |||||||||||||||||||||||||||||
| Interest expense, net | 56,467 | 3.6% | 59,241 | 4.0% | 68,310 | 4.6% | |||||||||||||||||||||||||||||
| Refinancing costs | 906 | 0.1% | 3,008 | 0.2% | — | —% | |||||||||||||||||||||||||||||
| Income (loss) before income taxes | 56,596 | 3.6% | 26,552 | 1.8% | (7,382) | (0.5)% | |||||||||||||||||||||||||||||
| Income tax expense | 16,291 | 1.0% | 9,297 | 0.6% | 2,207 | 0.1% | |||||||||||||||||||||||||||||
| Net income (loss) | $ | 40,305 | 2.6% | $ | 17,255 | 1.2% | $ | (9,589) | (0.6)% | ||||||||||||||||||||||||||
Adjusted EBITDA (1) | 275,317 | 17.7% | 241,753 | 16.4% | 219,360 | 14.9% | |||||||||||||||||||||||||||||
(1) Adjusted EBITDA is a non-GAAP financial measure. Refer to the “Non-GAAP Financial Measures” section for additional information, including our definition and our use of Adjusted EBITDA, and for a reconciliation from Net income (loss) to Adjusted EBITDA.
Net Sales
Net Sales by Product Line
| 2025 vs. 2024 | 2024 vs. 2023 | |||||||||||||||||||||||||||||||||||||||||||||||||||||||||||||
| 2025 | % of Net Sales | 2024 | % of Net Sales | $ Change | % Change | 2023 | % of Net Sales | $ Change | % Change | |||||||||||||||||||||||||||||||||||||||||||||||||||||
| Fastening and Hardware | $ | 1,051,361 | 67.7 | % | $ | 1,016,483 | 69.0 | % | 34,878 | 3.4 | % | $ | 1,021,803 | 69.2 | % | (5,320) | (0.5) | % | ||||||||||||||||||||||||||||||||||||||||||||
| Personal Protective | 270,937 | 17.5 | % | 229,925 | 15.6 | % | 41,012 | 17.8 | % | 216,403 | 14.7 | % | 13,522 | 6.2 | % | |||||||||||||||||||||||||||||||||||||||||||||||
Keys and Key Fobs | 188,954 | 12.2 | % | 178,083 | 12.1 | % | 10,871 | 6.1 | % | 186,031 | 12.6 | % | (7,948) | (4.3) | % | |||||||||||||||||||||||||||||||||||||||||||||||
| Engraving and Resharp | 40,972 | 2.6 | % | 48,104 | 3.3 | % | (7,132) | (14.8) | % | 52,240 | 3.5 | % | (4,136) | (7.9) | % | |||||||||||||||||||||||||||||||||||||||||||||||
| Consolidated | $ | 1,552,224 | $ | 1,472,595 | $ | 79,629 | $ | 1,476,477 | $ | (3,882) | ||||||||||||||||||||||||||||||||||||||||||||||||||||
See Note 2 - Summary of Significant Accounting Policies of the Notes to Consolidated Financial Statements for a reconciliation of net sales by product line to net sales by operating segment.
24| December 27, 2025 Form 10-K | ||||||||
Net Sales by Segment
| 2025 vs. 2024 | 2024 vs. 2023 | |||||||||||||||||||||||||||||||||||||||||||||||||||||||||||||
| 2025 | % of Net Sales | 2024 | % of Net Sales | $ Change | % Change | 2023 | % of Net Sales | $ Change | % Change | |||||||||||||||||||||||||||||||||||||||||||||||||||||
| Hardware and Protective Solutions | $ | 1,193,957 | 76.9 | % | $ | 1,107,993 | 75.2 | % | $ | 85,964 | 7.8 | % | $ | 1,090,473 | 73.9 | % | $ | 17,520 | 1.6 | % | ||||||||||||||||||||||||||||||||||||||||||
| Robotics and Digital Solutions | 220,157 | 14.2 | % | 216,701 | 14.7 | % | 3,456 | 1.6 | % | 229,546 | 15.5 | % | (12,845) | (5.6) | % | |||||||||||||||||||||||||||||||||||||||||||||||
| Canada | 138,110 | 8.9 | % | 147,901 | 10.0 | % | (9,791) | (6.6) | % | 156,458 | 10.6 | % | (8,557) | (5.5) | % | |||||||||||||||||||||||||||||||||||||||||||||||
| Consolidated | $ | 1,552,224 | $ | 1,472,595 | $ | 79,629 | $ | 1,476,477 | $ | (3,882) | ||||||||||||||||||||||||||||||||||||||||||||||||||||
Hardware and Protective Solutions revenues consist primarily of the delivery of fasteners, anchors, specialty fastening products, and personal protective equipment such as gloves and eye-wear as well as accessories and in-store merchandising services for the related product category.
Robotics and Digital Solutions revenues consist primarily of sales of keys and identification tags through self-service key duplication and engraving kiosks. It also includes our associate-assisted key duplication systems.
Canada revenues consist primarily of the delivery to Canadian customers of fasteners and related hardware items, threaded rod, keys, key duplicating systems, accessories, personal protective equipment, and identification items as well as in-store merchandising services for the related product category.
Net sales increased $79.6 million in total during 2025. The increase in net sales was primarily driven by the factors described below:
Hardware and Protective Solutions increased $86.0 million due to the following:
•Hardware sales increased $45.9 million primarily driven by $59.4 million in price increases offset by $13.9 million in reduced volume driven by market softness.
•Protective equipment sales increased by $40.0 million primarily driven by $40.5 million of net sales added by the acquisition of Intex. Additionally, sales were impacted by price increases of $9.5 million offset by $9.5 million in reduced volume.
Robotics and Digital Solutions sales increased $3.5 million primarily driven by $14.3 million in price increases offset by $11.2 million in reduced volume.
Canada net sales decreased by $9.8 million primarily due to volume decreases of $4.8 million, an unfavorable impact of the exchange rate from Canadian dollars to U.S. dollars of $2.8 million, and price decreases of $2.2 million.
Cost of Sales (excluding depreciation and amortization)
The following table summarizes cost of sales by segment:
| 2025 vs. 2024 | 2024 vs. 2023 | |||||||||||||||||||||||||||||||||||||||||||||||||||||||||||||
| 2025 | % of Segment Net Sales | 2024 | % of Segment Net Sales | $ Change | % Change | 2023 | % of Segment Net Sales | $ Change | % Change | |||||||||||||||||||||||||||||||||||||||||||||||||||||
| Hardware and Protective Solutions | $ | 654,836 | 54.8% | $ | 617,689 | 55.7% | $ | 37,147 | 6.0% | $ | 667,072 | 61.2% | $ | (49,383) | (7.4)% | |||||||||||||||||||||||||||||||||||||||||||||||
| Robotics and Digital Solutions | 59,817 | 27.2% | 60,233 | 27.8% | (416) | (0.7)% | 64,389 | 28.1% | (4,156) | (6.5)% | ||||||||||||||||||||||||||||||||||||||||||||||||||||
| Canada | 81,222 | 58.8% | 86,769 | 58.7% | (5,547) | (6.4)% | 97,495 | 62.3% | (10,726) | (11.0)% | ||||||||||||||||||||||||||||||||||||||||||||||||||||
| Consolidated | $ | 795,875 | $ | 764,691 | $ | 31,184 | $ | 828,956 | $ | (64,265) | ||||||||||||||||||||||||||||||||||||||||||||||||||||
Hardware and Protective Solutions cost of sales as a percentage of net sales decreased primarily due to the timing of price increases driven by higher tariff costs. During 2025, we began taking pricing actions with our customers to align with the additional tariff costs we paid in 2025. We expect higher tariff expense to be included in our cost of sales as we sell through the inventory purchased prior to the new tariffs and transition to selling inventory purchased after the new tariffs. These were partially offset by a higher mix of Protective Solutions sales which generally have higher costs than Hardware Solutions products.
Our Robotics and Digital Solutions cost of sales as a percentage of net sales decreased primarily due to the impact of price increases and sales mix.
Canada cost of sales as a percentage of net sales was comparable to prior year.
25| December 27, 2025 Form 10-K | ||||||||
Selling, Warehouse, and General and Administrative Expenses
The following table summarizes selling, warehouse, and general and administrative expense ("SG&A") by segment:
| 2025 vs. 2024 | 2024 vs. 2023 | ||||||||||||||||||||||||||||||||||||||||||||||||||||||||||
| 2025 | % of Segment Net Sales | 2024 | % of Segment Net Sales | $ Change | % Change | 2023 | % of Segment Net Sales | $ Change | % Change | ||||||||||||||||||||||||||||||||||||||||||||||||||
| Hardware and Protective Solutions | $ | 360,570 | 30.2 | % | $ | 348,532 | 31.5 | % | $ | 12,038 | 3.5 | % | $ | 317,177 | 29.1 | % | $ | 31,355 | 9.9 | % | |||||||||||||||||||||||||||||||||||||||
| Robotics and Digital Solutions | 95,600 | 43.4 | % | 92,813 | 42.8 | % | 2,787 | 3.0 | % | 90,239 | 39.3 | % | 2,574 | 2.9 | % | ||||||||||||||||||||||||||||||||||||||||||||
| Canada | 45,830 | 33.2 | % | 47,357 | 32.0 | % | (1,527) | (3.2) | % | 44,694 | 28.6 | % | 2,663 | 6.0 | % | ||||||||||||||||||||||||||||||||||||||||||||
| Consolidated | $ | 502,000 | $ | 488,702 | $ | 13,298 | $ | 452,110 | $ | 36,592 | |||||||||||||||||||||||||||||||||||||||||||||||||
Hardware and Protective Solutions SG&A increased in 2025 due to the following:
•Selling expense increased by $9.6 million primarily due to increased compensation and benefit expense.
•Warehouse expense increased $1.9 million due to inflation in shipping costs along with rent and maintenance. Additionally, warehouse expense includes $1.0 million in costs incurred related to our Cincinnati, Ohio distribution center consolidation project.
•General and administrative (“G&A”) increased by $0.5 million. The increase was primarily driven by an increased investment into information technology along with increased compensation and benefit expenses and legal fees. These current year increases were partially offset by lower bad debt expense in 2025 relative to 2024. The year ended December 28, 2024 included a write off of $8.4 million of accounts receivable, net, due to True Value declaring bankruptcy.
Robotics and Digital Solutions SG&A increased in 2025 due to the following:
•Selling expense increased by $6.4 million primarily due to the shift from full-service keys to self-service keys, which have a higher variable selling cost.
•Warehouse expense increased by $1.4 million due to inflation in labor and shipping costs.
•G&A decreased by $5.0 million. The decrease was primarily due to a $5.0 million settlement agreement with a kiosk development partner in 2024 (see Note 15 - Commitments and Contingencies).
Canada SG&A decreased in 2025 due to the following:
•Selling expense decreased $0.3 million primarily due to lower severance costs in the current year as relative to 2024.
•Warehouse expense decreased $0.9 million primarily due to lower sales volumes along with improved operational efficiencies in addition to lower severance costs in the current year as relative to 2024 due to restructuring activities in the prior year.
•G&A was comparable to prior year.
Other Operating Expenses
Depreciation expense increased $11.1 million due to increased capital spend on merchandising racks along with key duplication kiosks.
Amortization expense was comparable to prior year.
In the year ended December 27, 2025, other (income) expense, net consisted primarily of a $0.2 million gain on the revaluation of the contingent consideration associated with the acquisition of Resharp and Instafob (see Note 14 - Fair Value Measurements of the Notes to Consolidated Financial Statements for additional information) along with income from certain rebates received. In the year ended December 28, 2024, other expense (income), net consisted primarily of an exchange rate loss of $0.9 million and a $0.2 million loss on the revaluation of the contingent consideration associated with the acquisition of Resharp and Instafob. Offsetting these losses was income from certain rebates received.
26| December 27, 2025 Form 10-K | ||||||||
Income from Operations
| 2025 vs. 2024 | 2024 vs. 2023 | |||||||||||||||||||||||||||||||||||||||||||
| 2025 | 2024 | $ Change | % Change | 2023 | $ Change | % Change | ||||||||||||||||||||||||||||||||||||||
| Hardware and Protective Solutions | $ | 90,553 | $ | 60,138 | $ | 30,415 | 50.6 | % | $ | 11,644 | $ | 48,494 | 416.5 | % | ||||||||||||||||||||||||||||||
| Robotics and Digital Solutions | 17,322 | 20,549 | (3,227) | (15.7) | % | 39,676 | (19,127) | (48.2) | % | |||||||||||||||||||||||||||||||||||
| Canada | 6,094 | 8,114 | (2,020) | (24.9) | % | 9,608 | (1,494) | (15.5) | % | |||||||||||||||||||||||||||||||||||
| Total segment income from operations | $ | 113,969 | $ | 88,801 | $ | 25,168 | 28.3 | % | $ | 60,928 | $ | 27,873 | 45.7 | % | ||||||||||||||||||||||||||||||
Income from operations in our Hardware and Protective Solutions segment increased $30.4 million due to the changes in net sales, cost of sales, SG&A expense, and other (income) expense, net described above. Depreciation expense increased by $6.3 million due to increased capital spend on merchandising racks and facility relocations completed in the prior year.
Income from operations in our Robotics and Digital Solutions segment decreased by $3.2 million primarily due to the changes in net sales, cost of sales, and SG&A expenses described above and a $4.8 million increase in depreciation expense associated with increased capital spend on key machines. Offsetting this increased expense was a gain of $0.5 million in other (income) expense driven by the changes in revaluation of the contingent consideration.
Canada's income from operations decreased by $2.0 million primarily due to the changes in net sales, cost of sales, and SG&A expenses described above. Canada also recorded exchange rate loss of $0.1 million in 2025 compared to a loss of $0.7 million in 2024.
Income (Loss) Before Income Taxes
Interest expense, net, decreased $2.8 million primarily due to a reduction in outstanding debt and a reduction in interest rate spreads driven by the debt repricing in the first quarter of 2025 (see Note 7 - Long-Term Debt of the Notes to Consolidated Financial Statements for additional information).
Income Taxes:
For the years ended December 27, 2025 and December 28, 2024 the effective income tax rate was 28.8% and 35.0%, respectively. The Company recorded an income tax provision for the year ended December 27, 2025 of $16.3 million, and an income tax provision for the year ended December 28, 2024 of $9.3 million.
In 2025, the Company's effective tax rate differed from the U.S. federal statutory tax rate due to certain non-deductible expenses. In addition, the effective tax rate differed due to state and foreign income taxes and our federal research and development credit.
In 2024, the Company's effective tax rate differed from the U.S. federal statutory tax rate primarily due to certain non-deductible expenses. In addition, the effective tax rate differed due to state and foreign income taxes and withholding taxes on distributions from our Canadian subsidiary.
Year Ended December 28, 2024 vs Year Ended December 30, 2023
For a comparison of our results of operations for fiscal 2024 to fiscal 2023, see “Part II, Item 7. Management’s Discussion and Analysis of Financial Condition and Results of Operations" of our Form 10-K for fiscal 2024.
27| December 27, 2025 Form 10-K | ||||||||
Non-GAAP Financial Measures
Adjusted EBITDA is a non-GAAP financial measure and is the primary basis used to measure the operational strength and performance of our businesses, as well as to assist in the evaluation of underlying trends in our businesses. This measure eliminates the significant level of noncash depreciation and amortization expense that results from the capital-intensive nature of our businesses and from intangible assets recognized in business combinations. It is also unaffected by our capital and tax structures, as our management excludes these results when evaluating our operating performance. Our management and Board of Directors use this financial measure to evaluate our consolidated operating performance and the operating performance of our operating segments and to allocate resources and capital to our operating segments. Additionally, we believe that Adjusted EBITDA is useful to investors because it is one of the bases for comparing our operating performance with that of other companies in our industries, although our measure of Adjusted EBITDA may not be directly comparable to similar measures used by other companies.
The following table presents a reconciliation of Net income (loss), the most directly comparable financial measures under GAAP, to Adjusted EBITDA for the periods presented:
| (dollars in thousands) | Year Ended December 27, 2025 | Year Ended December 28, 2024 | Year Ended December 30, 2023 | ||||||||||||||
| Net income (loss) | $ | 40,305 | $ | 17,255 | $ | (9,589) | |||||||||||
| Income tax expense | 16,291 | 9,297 | 2,207 | ||||||||||||||
| Interest expense, net | 56,467 | 59,241 | 68,310 | ||||||||||||||
| Depreciation | 79,870 | 68,766 | 59,331 | ||||||||||||||
| Amortization | 61,232 | 61,274 | 62,309 | ||||||||||||||
| EBITDA | $ | 254,165 | $ | 215,833 | $ | 182,568 | |||||||||||
| Stock compensation expense | 14,246 | 13,463 | 12,004 | ||||||||||||||
Restructuring and other costs(1) | 4,058 | 2,978 | 3,031 | ||||||||||||||
Litigation expense (2) | 1,950 | 5,000 | 339 | ||||||||||||||
Transaction and integration expense (3) | 232 | 1,243 | 1,754 | ||||||||||||||
| Change in fair value of contingent consideration | (240) | 228 | (4,936) | ||||||||||||||
Refinancing costs (4) | 906 | 3,008 | — | ||||||||||||||
Impairment charges (5) | — | — | 24,600 | ||||||||||||||
| Adjusted EBITDA | $ | 275,317 | $ | 241,753 | $ | 219,360 | |||||||||||
(1)Restructuring and other costs includes consulting and other costs associated with severance related to our distribution center relocations and corporate restructuring activities. 2024 and 2023 include costs associated with the Cybersecurity Incident that occurred in May 2023, see Note 15 - Commitments and Contingencies of the Notes to Consolidated Financial Statements for additional information.
(2)Litigation expense includes an accrual for the tentative settlement of a California wage-hour class action / Private Attorneys General Act (PAGA) claim in 2025 along with a settlement and legal fees paid in association with a dispute with a kiosk development partner in 2024, and litigation with the Hy-Ko Products Company LLC litigation (see Note 15 - Commitments and Contingencies of the Notes to Consolidated Financial Statements for additional information).
(3)Transaction and integration expense includes professional fees and other costs related to acquisition activity, including without limitation the Koch Industries, Inc. and Intex DIY, Inc acquisitions and the CCMP secondary offerings in 2023.
(4)In the first quarters of 2025 and 2024, we entered into a Repricing Amendment (2025 Repricing Amendment and 2024 Repricing Amendment) on our existing Senior Term Loan due July 14, 2028 (see Note 7 - Long-Term Debt of the Notes to Consolidated Financial Statements for additional information).
(5)In the fourth quarter of 2023, we recorded an impairment charge in our Hardware and Protective Solutions segment of $24.6 million, primarily related to review of certain product offerings. In the fourth quarter of 2023, we evaluated a specific product line and decided to exit certain retail locations and markets, which reduced the future cash flows from this product line and impacted the lower of cost or market valuation of inventory. As a result of this review we impaired $19.6 million of intangible assets and recorded inventory revaluation charges of $5.0 million.
The following tables present a reconciliation of segment operating income, the most directly comparable financial measures under GAAP, to segment Adjusted EBITDA for the periods presented (amounts in thousands). Certain amounts in the prior year presentation between segments were reclassified to conform to the current year’s presentation:
28| December 27, 2025 Form 10-K | ||||||||
| Year Ended December 27, 2025 | Hardware and Protective Solutions | Robotics and Digital Solutions | Canada | ||||||||||||||
| Operating income | $ | 90,553 | $ | 17,322 | $ | 6,094 | |||||||||||
| Depreciation and amortization | 88,829 | 47,390 | 4,883 | ||||||||||||||
| Stock compensation expense | 12,080 | 1,144 | 1,022 | ||||||||||||||
| Restructuring and other costs | 2,783 | 120 | 1,155 | ||||||||||||||
| Litigation expense | 1,780 | 170 | — | ||||||||||||||
| Transaction and integration expense | 225 | 7 | — | ||||||||||||||
| Change in fair value of contingent consideration | — | (240) | — | ||||||||||||||
| Adjusted EBITDA | $ | 196,250 | $ | 65,913 | $ | 13,154 | |||||||||||
| Year Ended December 28, 2024 | Hardware and Protective Solutions | Robotics and Digital Solutions | Canada | ||||||||||||||
| Operating income | $ | 60,138 | $ | 20,549 | $ | 8,114 | |||||||||||
| Depreciation and amortization | 82,446 | 42,661 | 4,933 | ||||||||||||||
| Stock compensation expense | 11,562 | 1,117 | 784 | ||||||||||||||
| Restructuring and other costs | 340 | 689 | 1,949 | ||||||||||||||
| Litigation expense | — | 5,000 | — | ||||||||||||||
| Transaction and integration expense | 1,212 | 31 | — | ||||||||||||||
| Change in fair value of contingent consideration | — | 228 | — | ||||||||||||||
| Adjusted EBITDA | $ | 155,698 | $ | 70,275 | $ | 15,780 | |||||||||||
Year Ended December 30, 2023 | Hardware and Protective Solutions | Robotics and Digital Solutions | Canada | ||||||||||||||
| Operating income | $ | 11,644 | $ | 39,676 | $ | 9,608 | |||||||||||
| Depreciation and amortization | 76,757 | 40,055 | 4,828 | ||||||||||||||
| Stock compensation expense | 10,204 | 1,035 | 765 | ||||||||||||||
| Restructuring and other costs | 2,582 | 339 | 110 | ||||||||||||||
| Litigation expense | — | 339 | — | ||||||||||||||
| Transaction and integration expense | 1,594 | 160 | — | ||||||||||||||
| Impairment charges | 24,600 | — | — | ||||||||||||||
| Change in fair value of contingent consideration | — | (4,936) | — | ||||||||||||||
| Adjusted EBITDA | $ | 127,381 | $ | 76,668 | $ | 15,311 | |||||||||||
Liquidity and Capital Resources:
The following table presents the key categories of our consolidated statements of cash flows:
| Year Ended December 27, 2025 | Year Ended December 28, 2024 | $ Change | Year Ended December 30, 2023 | $ Change | ||||||||||||||||||||||||||||
| Net cash provided by operating activities | $ | 105,185 | $ | 183,336 | $ | (78,151) | $ | 238,035 | $ | (54,699) | ||||||||||||||||||||||
| Net cash used for investing activities | (70,351) | (143,397) | 73,046 | (67,852) | (75,545) | |||||||||||||||||||||||||||
| Net cash used for financing activities | (52,220) | (39,268) | (12,952) | (161,976) | 122,708 | |||||||||||||||||||||||||||
| Net (decrease) increase in cash and cash equivalents | (17,234) | 5,957 | (23,191) | 7,472 | (1,515) | |||||||||||||||||||||||||||
29| December 27, 2025 Form 10-K | ||||||||
Operating Cash Flows:
Operating cash flows for the year ended December 27, 2025 were unfavorably impacted by increases in the costs of inventory and other accrued liabilities due to the recently enacted tariffs.
Operating cash flows for the year ended for the year ended December 28, 2024 were unfavorably impacted by increases in accounts receivable due to accounts receivable generated by the Koch business post acquisition. Additionally, we saw increased accrued liabilities due to the timing of inventory purchases and payments. Finally, in 2024 we saw increases in accrued incentive compensation which favorably impacted our cash flow from operating activities.
Investing Cash Flows:
Capital Expenditures:
Cash of $70.1 million, $85.2 million, and $65.8 million, was used in the years ending December 27, 2025, December 28, 2024 and December 30, 2023, respectively, to invest in new key duplicating kiosks and machines and merchandising racks.
Acquisitions:
In 2025, the Company did not complete any new acquisitions. In 2024, the Company completed its acquisitions of Koch Industries, Inc and Intex DIY, Inc for a total purchase price of $23.8 million and $34.1 million, respectively (see Note 5 - Acquisitions of the Notes to Consolidated Financial Statements for additional information).
Financing Cash Flows:
Term Loan:
The Company used $8.5 million of cash for principal payments on the senior term loan. As of December 27, 2025, we have outstanding borrowings of $637.0 million on the term loan. In 2024 the Company used $106.4 million of cash for principal payments on the senior term loan, including a $100.0 million prepayment against the outstanding term loan balance without payment of a premium or penalty. See Note 7 - Long-Term Debt of the Notes to Consolidated Financial Statements for additional information.
ABL Revolver:
Our revolver draws, net of repayments, used cash of $26.0 million in the year ended December 27, 2025 primarily used to fund the additional tariff costs in the current year. During the year ended December 28, 2024, our revolver repayments, net of draws, provided cash of $62.0 million as part of the Company's initiative to pay down the term loan along with the acquisitions of Koch and Intex.
Treasury Stock:
In the year ended December 27, 2025, the Company repurchased $12.4 million of its common stock, see Note 10 - Equity and Accumulated Other Comprehensive Loss of the Notes to Consolidated Financial Statements for additional information.
Stock Option Exercises:
In the years ended December 27, 2025, December 28, 2024, and December 30, 2023, the Company received $1.2 million, $9.7 million, and $2.2 million, respectively, from the exercise of stock options.
Liquidity:
We believe that projected cash flows from operations and ABL Revolver availability will be sufficient to fund working capital and capital expenditure needs for the next 12 months. As of December 27, 2025, the ABL Revolver had an outstanding balance of $36.0 million and had outstanding letters of credit of $3.3 million, leaving $279.1 million of available borrowings as a source of liquidity. Our material cash requirements for known contractual obligations include, debt, and lease obligations, each of which are discussed in more detail earlier in this section and in the footnotes to consolidated financial statements, along with capital expenditures. Our future investments
30| December 27, 2025 Form 10-K | ||||||||
will depend primarily on the builds of new key duplicating kiosks and machines, merchandising racks, and IT projects that we undertake and the timing of these expenditures.
We also have cash requirements for purchase orders and contracts for the purchase of inventory and other goods and services, which are based on current distribution needs and are fulfilled by our suppliers within the short term.
Our working capital (current assets minus current liabilities) position of $388.9 million as of December 27, 2025 represents an increase of $69.4 million from the December 28, 2024 level of $319.5 million driven primarily by the impact of tariff costs and related increases in receivables driven by increased prices. We expect to generate sufficient operating cash flows to meet our short-term liquidity needs, and we expect to maintain access to the capital markets, although there can be no assurance of our ability to do so. However, disruption and volatility in the global capital markets, could impact our capital resources and liquidity in the future.
Related Party Transactions:
The information required by this Item is set forth in the section entitled Related Party Transactions in the 2026 Proxy Statement and is hereby incorporated by reference into this Form 10-K.
Critical Accounting Policies and Estimates:
Our accounting policies are more fully described in Note 2 - Summary of Significant Accounting Policies of the Notes to Consolidated Financial Statements. As disclosed in that note, the preparation of financial statements in conformity with accounting principles generally accepted in the United States requires management to make estimates and assumptions that affect the reported amount of assets and liabilities and disclosure of contingent assets and liabilities at the date of the financial statements and the reported amounts of revenues and expenses during the reporting period. Future events cannot be predicted with certainty and, therefore, actual results could differ from those estimates. The following section describes our critical accounting policies.
Inventory Realization:
Inventories consisting predominantly of finished goods are valued at the lower of cost or net realizable value, cost being determined principally on the standard cost method, which approximates the first-in-first-out “FIFO” method. The historical usage rate is the primary factor used in assessing the net realizable value of excess and obsolete inventory. A reduction in the carrying value of an inventory item from cost to net realizable value is recorded for inventory with excess on-hand quantities as determined based on historic and projected sales, product category, and stage in the product life cycle. We do not believe there is a reasonable likelihood that there will be a material change in the estimates or assumptions we use to calculate our excess and obsolete inventory reserve. However, if our estimates regarding excess and obsolete inventory are inaccurate, we may be exposed to losses or gains that could be material. A 5% difference in actual excess and obsolete inventory reserved for at December 27, 2025 would have affected net earnings by approximately $1.6 million in fiscal 2025.
Goodwill:
We have adopted ASU 2017-04, Intangibles – Goodwill and Other (Topic 350): Simplifying the Test for Goodwill Impairment, which eliminates Step 2 from the goodwill impairment test and instead requires an entity to perform its annual, or interim, goodwill impairment test by comparing the fair value of a reporting unit with its carrying amount. If, after assessing the totality of events or circumstances, we determine that the fair value of a reporting unit is less than the carrying value, then we would recognize an impairment charge for the amount by which the carrying amount exceeds the reporting unit's fair value, not to exceed the total amount of goodwill allocated to the reporting unit.
Our annual impairment assessment is performed for the reporting units as of October 1. In 2025, 2024, and 2023, with the assistance of an independent third-party specialist, management assessed the value of our reporting units based on a based on a discounted cash flow model and a guideline public company method. Assumptions critical to our fair value estimates under the discounted cash flow model include the projected net sales and EBITDA growth rates and the discount rates. The results of the quantitative assessments in 2025, 2024, and 2023 indicated that the fair value of each reporting unit was in excess of its carrying value.
Significant assumptions used in the determination of the estimated fair values of the reporting units are the projected net sales and EBITDA growth rates and the discount rate. The projected net sales and EBITDA growth rates are dependent on overall market growth rates, the competitive environment, inflation and our ability to pass price increase along to our customers, relative currency exchange rates, and business activities that impact market
31| December 27, 2025 Form 10-K | ||||||||
share. As a result, the growth rate could be adversely impacted by a sustained deceleration in category growth, devaluation of the U.S. Dollar against other currencies, an increased competitive environment, or an economic recession. The discount rate, which is consistent with a weighted average cost of capital that is likely to be expected by a market participant, is based upon industry required rates of return, including consideration of both debt and equity components of the capital structure. Our discount rate may be impacted in the future by adverse changes in the macroeconomic environment and volatility in the equity and debt markets.
While management can and has implemented strategies to address these events, changes in operating plans or adverse changes in the future could reduce the underlying cash flows used to estimate fair values and could result in a decline in fair value that would trigger future impairment charges. As of December 27, 2025, the carrying value of our largest reporting unit, Hardware Solutions, goodwill was $450.9 million.
Recent Accounting Pronouncements:
Recently issued accounting standards are described in Note 3 - Recent Accounting Pronouncements of the Notes to Consolidated Financial Statements.
| ITEM 7A – QUANTITATIVE AND QUALITATIVE DISCLOSURES ABOUT MARKET RISK. | ||
Interest Rate Exposure
We are exposed to the impact of interest rate changes as our borrowings bear interest at variable interest rates. It is our policy to enter into interest rate swaps only to the extent considered necessary to meet our objectives.
Based on our exposure to variable rate borrowings at December 27, 2025, after consideration of our SOFR floor rates and interest rate swap agreements, a one percent (1%) change in the weighted average interest rate for a period of one year would change the annual interest expense by approximately $3.1 million.
Foreign Currency Exchange
We are exposed to foreign exchange rate changes of the Canadian and Mexican currencies as it impacts the $134.7 million net asset value of our Canadian and Mexican subsidiaries as of December 27, 2025. The foreign subsidiaries' net tangible assets were $81.7 million and the net intangible assets were $52.9 million as of December 27, 2025.
We utilize foreign exchange forward contracts to manage the exposure to currency fluctuations in the Canadian dollar versus the U.S. Dollar. See Note 13 - Derivatives and Hedging of the Notes to Consolidated Financial Statements.
32| December 27, 2025 Form 10-K | ||||||||
| ITEM 8 – FINANCIAL STATEMENTS AND SUPPLEMENTARY DATA. | ||
| INDEX TO CONSOLIDATED FINANCIAL STATEMENTS AND FINANCIAL STATEMENT SCHEDULE | Page | ||||
Report of Independent Registered Public Accounting Firm - Deloitte & Touche LLP | |||||
| Consolidated Financial Statements: | |||||
| Financial Statement Schedule: | |||||
33| December 27, 2025 Form 10-K | ||||||||
Report of Management on Internal Control Over Financial Reporting
Our management is responsible for establishing and maintaining adequate internal control over financial reporting to provide reasonable assurance regarding the reliability of our financial reporting and the preparation of financial statements for external purposes in accordance with accounting principles generally accepted in the United States. Internal control over financial reporting includes those policies and procedures that (i) pertain to the maintenance of records that, in reasonable detail, accurately and fairly reflect the transactions and dispositions of the assets of Hillman Solutions Corp. and its consolidated subsidiaries; (ii) provide reasonable assurance that transactions are recorded as necessary to permit preparation of financial statements in accordance with accounting principles generally accepted in the United States, and that receipts and expenditures of Hillman Solutions Corp. and its consolidated subsidiaries are being made only in accordance with authorizations of management and directors of Hillman Solutions Corp. and its consolidated subsidiaries, as appropriate; and (iii) provide reasonable assurance regarding prevention or timely detection of unauthorized acquisition, use or disposition of the assets of Hillman Solutions Corp. and its consolidated subsidiaries that could have a material effect on the consolidated financial statements.
Our management, with the participation of our principal executive officer and principal financial officer, assessed the effectiveness of our internal control over financial reporting as of December 27, 2025, the end of our fiscal year. Management based its assessment on criteria established in Internal Control — Integrated Framework (2013) issued by the Committee of Sponsoring Organizations of the Treadway Commission. Management's assessment included evaluation of such elements as the design and operating effectiveness of key financial reporting controls, process documentation, accounting policies, and our overall control environment. This assessment is supported by testing and monitoring performed under the direction of management.
Because of its inherent limitations, internal control over financial reporting may not prevent or detect misstatements. Also, projections of any evaluations of effectiveness to future periods are subject to the risk that controls may become inadequate because of changes in conditions, or that the degree of compliance with the policies or procedures may deteriorate. Accordingly, even an effective system of internal control over financial reporting will provide only reasonable assurance with respect to financial statement preparation.
Based on its assessment, our management has concluded that our internal control over financial reporting was effective, as of December 27, 2025, to provide reasonable assurance regarding the reliability of financial reporting and the preparation of financial statements for external reporting purposes in accordance with accounting principles generally accepted in the United States. We reviewed the results of management's assessment with the Audit Committee of Hillman Solutions Corp.
/s/ JON MICHAEL ADINOLFI | /s/ ROBERT O. KRAFT | |||||||||||||
Jon Michael Adinolfi | Robert O. Kraft | |||||||||||||
| President and Chief Executive Officer | Chief Financial Officer | |||||||||||||
| Dated: | February 17, 2026 | Dated: | February 17, 2026 | |||||||||||
34| December 27, 2025 Form 10-K | ||||||||
REPORT OF INDEPENDENT REGISTERED PUBLIC ACCOUNTING FIRM
To the Shareholders and the Board of Directors of Hillman Solutions Corp.
Opinion on the Financial Statements
We have audited the accompanying consolidated balance sheets of Hillman Solutions Corp. and subsidiaries (the "Company") as of December 27, 2025 and December 28, 2024, the related consolidated statements of comprehensive income (loss), cash flows, and stockholders' equity, for each of the three years in the period ended December 27, 2025, and the related notes and the financial statement schedule II - Valuation Accounts (collectively referred to as the "financial statements"). In our opinion, the financial statements present fairly, in all material respects, the financial position of the Company as of December 27, 2025 and December 28, 2024, and the results of its operations and its cash flows for each of the three years in the period ended December 27, 2025, in conformity with accounting principles generally accepted in the United States of America.
We have also audited, in accordance with the standards of the Public Company Accounting Oversight Board (United States) (PCAOB), the Company's internal control over financial reporting as of December 27, 2025, based on criteria established in Internal Control — Integrated Framework (2013) issued by the Committee of Sponsoring Organizations of the Treadway Commission and our report dated February 17, 2026, expressed an unqualified opinion on the Company's internal control over financial reporting.
Basis for Opinion
These financial statements are the responsibility of the Company's management. Our responsibility is to express an opinion on the Company's financial statements based on our audits. We are a public accounting firm registered with the PCAOB and are required to be independent with respect to the Company in accordance with the U.S. federal securities laws and the applicable rules and regulations of the Securities and Exchange Commission and the PCAOB.
We conducted our audits in accordance with the standards of the PCAOB. Those standards require that we plan and perform the audit to obtain reasonable assurance about whether the financial statements are free of material misstatement, whether due to error or fraud. Our audits included performing procedures to assess the risks of material misstatement of the financial statements, whether due to error or fraud, and performing procedures that respond to those risks. Such procedures included examining, on a test basis, evidence regarding the amounts and disclosures in the financial statements. Our audits also included evaluating the accounting principles used and significant estimates made by management, as well as evaluating the overall presentation of the financial statements. We believe that our audits provide a reasonable basis for our opinion.
Critical Audit Matter
The critical audit matter communicated below is a matter arising from the current-period audit of the financial statements that was communicated or required to be communicated to the audit committee and that (1) relates to accounts or disclosures that are material to the financial statements and (2) involved our especially challenging, subjective, or complex judgments. The communication of critical audit matters does not alter in any way our opinion on the financial statements, taken as a whole, and we are not, by communicating the critical audit matter below, providing a separate opinion on the critical audit matter or on the accounts or disclosures to which it relates.
Goodwill – Hardware Solutions Reporting Unit – Refer to Note 2 to the Financial Statements
Critical Audit Matter Description
The Company’s evaluation of goodwill for impairment involves the comparison of the fair value of each reporting unit to their respective carrying values.
The Company used both a discounted cash flow model and a guideline public company method to estimate the fair value of the Hardware Solutions (“HS”) reporting unit. The discounted cash flow model requires management to make significant estimates and assumptions including projected net sales and earnings before interest, taxes, depreciation, and amortization (“EBITDA”) growth rates and the discount rate. The guideline public company method requires the use of market price data of guideline public companies to estimate the fair value of the reporting unit. Changes in these assumptions could have a significant impact on either the fair value of the
35| December 27, 2025 Form 10-K | ||||||||
reporting unit, the amount of any goodwill impairment charge, or both. The Company’s consolidated goodwill balance was $830.7 million as of December 27, 2025, of which $450.9 million was allocated to the HS reporting unit. The estimated fair value of the HS reporting unit exceeded its carrying value as of the measurement date and, therefore, no impairment was recognized.
We identified the Company’s valuation of goodwill for the HS reporting unit as a critical audit matter because of the significant judgments made by management to estimate the fair value of this reporting unit. This required a high degree of auditor judgment and an increased extent of effort, including the need to involve our fair value specialists, when performing audit procedures to evaluate the reasonableness of certain of management’s estimates and assumptions, particularly related to projected net sales and EBITDA growth rates as well as the selection of the discount rate.
How the Critical Audit Matter Was Addressed in the Audit
Our audit procedures related to the estimates of projected net sales and EBITDA growth rates and the selection of the discount rate used by management to estimate the fair value of the HS reporting unit included the following, among others:
•We tested the effectiveness of controls over management’s goodwill impairment evaluation, including those over the determination of the fair value of the Hardware Solutions reporting unit, such as controls related to management’s forecasts of projected net sales and EBITDA growth rates and selection of the discount rate.
•We evaluated management’s ability to accurately forecast projected net sales and EBITDA growth rates by comparing actual results to management’s historical forecasts.
•We performed a sensitivity analysis of the projected net sales and EBITDA growth rates and selected discount rate, which included their impact on cash flows.
•We evaluated the reasonableness of management’s projected net sales and EBITDA growth rates by comparing the forecasts to (1) historical net sales and EBITDA growth rates, (2) underlying analysis detailing business strategies and growth plans, (3) internal communications to management and the Board of Directors, and (4) industry reports for the Company and certain of its peer companies.
•With the assistance of our internal fair value specialists, we evaluated the reasonableness of the valuation methodologies utilized, along with the discount rate and long-term net sales growth rate selected by:
◦Testing the source information underlying the determination of the discount rate and long-term net sales growth rate, including the mathematical accuracy of the calculation.
◦Developing a range of independent estimates for the discount rate and compared it to the rate selected by management.
◦Utilizing industry and market-specific growth trends to assess the reasonableness of the long-term net sales growth rate selected by management.
/s/ DELOITTE & TOUCHE LLP
Cincinnati, Ohio
February 17, 2026
We have served as the Company's auditor since 2022.
36| December 27, 2025 Form 10-K | ||||||||
HILLMAN SOLUTIONS CORP. AND SUBSIDIARIES
CONSOLIDATED BALANCE SHEETS
(dollars in thousands)
| December 27, 2025 | December 28, 2024 | ||||||||||
| ASSETS | |||||||||||
| Current assets: | |||||||||||
| Cash and cash equivalents | $ | $ | |||||||||
Accounts receivable, net of allowances of $ | |||||||||||
| Inventories, net | |||||||||||
| Other current assets | |||||||||||
| Total current assets | |||||||||||
Property and equipment, net of accumulated depreciation of $ | |||||||||||
| Goodwill | |||||||||||
Other intangibles, net of accumulated amortization of $ | |||||||||||
| Operating lease right of use assets | |||||||||||
| Other assets | |||||||||||
| Total assets | $ | $ | |||||||||
| LIABILITIES AND STOCKHOLDERS' EQUITY | |||||||||||
| Current liabilities: | |||||||||||
| Accounts payable | $ | $ | |||||||||
| Current portion of debt and finance lease obligations | |||||||||||
| Current portion of operating lease liabilities | |||||||||||
| Accrued expenses: | |||||||||||
| Salaries and wages | |||||||||||
| Pricing allowances | |||||||||||
| Income and other taxes | |||||||||||
| Other accrued expenses | |||||||||||
| Total current liabilities | |||||||||||
| Long-term debt | |||||||||||
| Deferred tax liabilities | |||||||||||
| Operating lease liabilities | |||||||||||
| Other non-current liabilities | |||||||||||
| Total liabilities | |||||||||||
| Commitments and Contingencies (Note 15) | |||||||||||
| Stockholders' equity: | |||||||||||
Common stock, | |||||||||||
Treasury stock, at cost, | ( | ||||||||||
| Additional paid-in capital | |||||||||||
| Accumulated deficit | ( | ( | |||||||||
| Accumulated other comprehensive loss | ( | ( | |||||||||
| Total stockholders' equity | |||||||||||
| Total liabilities and stockholders' equity | $ | $ | |||||||||
The Notes to Consolidated Financial Statements are an integral part of these statements.
37| December 27, 2025 Form 10-K | ||||||||
HILLMAN SOLUTIONS CORP. AND SUBSIDIARIES
CONSOLIDATED STATEMENTS OF COMPREHENSIVE Income (LOSS)
(dollars in thousands)
| Year Ended December 27, 2025 | Year Ended December 28, 2024 | Year Ended December 30, 2023 | |||||||||||||||
| Net sales | $ | $ | $ | ||||||||||||||
| Cost of sales (exclusive of depreciation and amortization shown separately below) | |||||||||||||||||
| Selling, warehouse, and general and administrative expenses | |||||||||||||||||
| Depreciation | |||||||||||||||||
| Amortization | |||||||||||||||||
| Other (income) expense, net | ( | ||||||||||||||||
| Income from operations | |||||||||||||||||
| Interest expense, net | |||||||||||||||||
| Refinancing costs | |||||||||||||||||
| Income (loss) before income taxes | ( | ||||||||||||||||
| Income tax expense | |||||||||||||||||
| Net income (loss) | $ | $ | $ | ( | |||||||||||||
| Basic income (loss) per share | $ | $ | $ | ( | |||||||||||||
| Weighted average basic shares outstanding | |||||||||||||||||
| Diluted income (loss) per share | $ | $ | $ | ( | |||||||||||||
| Weighted average diluted shares outstanding | |||||||||||||||||
| Net income (loss) from above | $ | $ | $ | ( | |||||||||||||
| Other comprehensive income (loss): | |||||||||||||||||
| Foreign currency translation adjustments | ( | ||||||||||||||||
| Hedging activity | ( | ( | |||||||||||||||
| Total other comprehensive income (loss) | ( | ( | |||||||||||||||
| Comprehensive income (loss) | $ | $ | $ | ( | |||||||||||||
The Notes to Consolidated Financial Statements are an integral part of these statements.
38| December 27, 2025 Form 10-K | ||||||||
HILLMAN SOLUTIONS CORP. AND SUBSIDIARIES
CONSOLIDATED STATEMENTS OF CASH FLOWS
(dollars in thousands)
| Year Ended December 27, 2025 | Year Ended December 28, 2024 | Year Ended December 30, 2023 | |||||||||||||||
| Cash flows from operating activities: | |||||||||||||||||
| Net income (loss) | $ | $ | $ | ( | |||||||||||||
| Adjustments to reconcile net income (loss) to net cash provided by operating activities: | |||||||||||||||||
| Depreciation and amortization | |||||||||||||||||
| Loss (gain) on dispositions of property and equipment | ( | ||||||||||||||||
| Impairment charges | |||||||||||||||||
| Deferred income taxes | ( | ( | |||||||||||||||
| Deferred financing and original issue discount amortization | |||||||||||||||||
| Loss on debt restructuring | |||||||||||||||||
| Cash paid to third parties in connection with debt restructuring | ( | ( | |||||||||||||||
| Stock-based compensation expense | |||||||||||||||||
| Customer bankruptcy reserve | |||||||||||||||||
| Change in fair value of contingent consideration | ( | ( | |||||||||||||||
| Changes in operating items: | |||||||||||||||||
| Accounts receivable | ( | ( | ( | ||||||||||||||
| Inventories | ( | ||||||||||||||||
| Other assets | ( | ( | |||||||||||||||
| Accounts payable | ( | ||||||||||||||||
| Accrued salaries and wages | |||||||||||||||||
| Other accrued liabilities | ( | ( | |||||||||||||||
| Net cash provided by operating activities | |||||||||||||||||
| Cash flows from investing activities: | |||||||||||||||||
| Acquisitions of businesses, net of cash acquired | ( | ( | |||||||||||||||
| Capital expenditures | ( | ( | ( | ||||||||||||||
| Other investing activities | ( | ( | ( | ||||||||||||||
| Net cash used for investing activities | ( | ( | ( | ||||||||||||||
| Cash flows from financing activities: | |||||||||||||||||
| Repayments of senior term loans | ( | ( | ( | ||||||||||||||
| Borrowings of revolving credit loans | |||||||||||||||||
| Repayments of revolving credit loans | ( | ( | ( | ||||||||||||||
| Repurchases of common stock | ( | ||||||||||||||||
| Financing fees | ( | ||||||||||||||||
| Principal payments under finance lease obligations | ( | ( | ( | ||||||||||||||
| Proceeds from exercise of stock options | |||||||||||||||||
| Payments of contingent consideration | ( | ( | ( | ||||||||||||||
| Other financing activities | ( | ( | |||||||||||||||
| Net cash used for financing activities | ( | ( | ( | ||||||||||||||
| Effect of exchange rate changes on cash | ( | ||||||||||||||||
| Net (decrease) increase in cash and cash equivalents | ( | ||||||||||||||||
| Cash and cash equivalents at beginning of period | |||||||||||||||||
| Cash and cash equivalents at end of period | $ | $ | $ | ||||||||||||||
The Notes to Consolidated Financial Statements are an integral part of these statements.
39| December 27, 2025 Form 10-K | ||||||||
HILLMAN SOLUTIONS CORP. AND SUBSIDIARIES
CONSOLIDATED STATEMENTS OF STOCKHOLDERS' EQUITY
(dollars in thousands)
| Common Stock Amount | Treasury Stock Amount | Additional Paid-in Capital | Accumulated Deficit | Accumulated Other Comprehensive Loss | Total Stockholders' Equity | |||||||||||||||||||||||||||||||||
December 31, 2022 | $ | $ | — | $ | $ | ( | $ | ( | $ | |||||||||||||||||||||||||||||
| Net loss | — | — | ( | — | ( | |||||||||||||||||||||||||||||||||
| Stock option activity, stock awards and employee stock purchase plan | — | — | — | |||||||||||||||||||||||||||||||||||
| Hedging activity | — | — | — | — | ( | ( | ||||||||||||||||||||||||||||||||
| Change in cumulative foreign currency translation adjustment | — | — | — | — | ||||||||||||||||||||||||||||||||||
December 30, 2023 | $ | $ | — | $ | $ | ( | $ | ( | $ | |||||||||||||||||||||||||||||
| Net income | — | — | — | — | ||||||||||||||||||||||||||||||||||
| Stock option activity, stock awards and employee stock purchase plan | — | — | — | — | ||||||||||||||||||||||||||||||||||
| Hedging activity | — | — | — | — | ||||||||||||||||||||||||||||||||||
| Change in cumulative foreign currency translation adjustment | — | — | — | — | ( | ( | ||||||||||||||||||||||||||||||||
December 28, 2024 | $ | $ | — | $ | $ | ( | $ | ( | $ | |||||||||||||||||||||||||||||
| Net income | — | — | — | — | ||||||||||||||||||||||||||||||||||
| Stock option activity, stock awards and employee stock purchase plan | — | — | — | — | ||||||||||||||||||||||||||||||||||
| Repurchases of common stock | — | ( | — | — | — | ( | ||||||||||||||||||||||||||||||||
| Hedging activity | — | — | — | — | ( | ( | ||||||||||||||||||||||||||||||||
| Change in cumulative foreign currency translation adjustment | — | — | — | — | ||||||||||||||||||||||||||||||||||
| Balance at December 27, 2025 | $ | $ | ( | $ | $ | ( | $ | ( | $ | |||||||||||||||||||||||||||||
The Notes to Consolidated Financial Statements are an integral part of these statements.
40| December 27, 2025 Form 10-K | ||||||||
1. BASIS OF PRESENTATION
The accompanying financial statements include the consolidated accounts of Hillman Solutions Corp. and its wholly-owned subsidiaries (collectively “Hillman” or the “Company”). Unless the context requires otherwise, references to "Hillman," "we," "us," "our," or "our Company" refer to Hillman Solutions Corp. and its wholly-owned subsidiaries. The Consolidated Financial Statements included herein have been prepared in accordance with accounting standards generally accepted in the United States of America ("U.S. GAAP"). All intercompany balances and transactions have been eliminated. References to 2025, 2024, and 2023 are for fiscal years ended December 27, 2025, December 28, 2024, and December 30, 2023, respectively. Certain amounts in the prior year presentation were reclassified to conform to the current year’s presentation.
"Hillman Solutions Corp.," "HMan Group Holdings Inc.," and "The Hillman Companies, Inc." are holding companies with no other operations, cash flows, material assets or liabilities other than the equity interests in "The Hillman Group, Inc.," which is the borrower under our credit facility.
The Company has a 52-53 week fiscal year ending on the last Saturday in December. In a 52 week fiscal year, each of the Company’s quarterly periods will consist of 13 weeks. The additional week in a 53 week fiscal year is added to the fourth quarter, making such quarter consist of 14 weeks. In 2025, 2024 and 2023, the Company had a 52 week fiscal year.
Nature of Operations:
The Company is comprised of three separate operating business segments: (1) Hardware and Protective Solutions, (2) Robotics and Digital Solutions, and (3) Canada.
In the second quarter of 2025, the Company realigned its Hardware and Protective Solutions segment to include the sales of accessories, which are now managed by the Hardware and Protective Solutions leadership team. Previously, accessories were included under the Robotics and Digital Solutions segment and managed by that leadership team. See Note 18 - Segment Reporting and Geographic Information for additional information.
Hillman provides and, on a limited basis, produces products such as fasteners and related hardware items; threaded rod and metal shapes; keys, key duplication systems, and accessories; personal protective equipment such as gloves and eye-wear; rope and chain; builder's hardware; and identification items, such as tags and letters, numbers, and signs, to retail outlets, primarily hardware stores, home centers and mass merchants, pet supply stores, grocery stores, and drug stores. The Canada segment also produces fasteners, stampings, fittings, and processes threaded parts for automotive suppliers, industrial Original Equipment Manufacturers (“OEMs”), and industrial distributors.
Reclassifications:
Due to the segment realignment mentioned above, certain amounts in the prior year Consolidated Financial Statements and in the Notes to the Consolidated Financial Statements were reclassified to conform to the current year’s presentation. This had no impact on the prior periods’ consolidated balance sheets, consolidated statements of comprehensive income (loss), consolidated statements of cash flows, or consolidated statements of stockholders' equity.
2. SUMMARY OF SIGNIFICANT ACCOUNTING POLICIES
Cash and Cash Equivalents:
Cash and cash equivalents consist of commercial paper, U.S. Treasury obligations, and other liquid securities purchased with initial maturities less than 90 days and are stated at cost which approximates fair value. The Company has foreign bank balances of approximately $13,492 and $25,647 at December 27, 2025 and December 28, 2024, respectively. The Company maintains cash and cash equivalent balances with financial institutions that exceed federally insured limits. The Company has not experienced any losses related to these balances.
Restricted Investments:
The Company's restricted investments are trading securities carried at fair market value which represent assets held in a Rabbi Trust to fund deferred compensation liabilities owed to the Company's employees. The current
41| December 27, 2025 Form 10-K | ||||||||
portion of the investments is included in other current assets and the long term portion in other assets on the accompanying Consolidated Balance Sheets. See Note 9 - Deferred Compensation Plan for additional information.
Accounts Receivable and Allowance for Doubtful Accounts:
The Company establishes the allowance for doubtful accounts by considering historical losses, adjusted to take into account current market conditions. The estimates for calculating the aggregate reserve are based on the financial condition of the customers, the length of time receivables are past due, historical collection experience, current economic trends, and reasonably supported forecasts. Increases to the allowance for doubtful accounts result in a corresponding expense. The Company writes off individual accounts receivable when collection becomes improbable. The allowance for doubtful accounts was $1,944 and $2,827 as of December 27, 2025 and December 28, 2024, respectively.
In the years ended December 27, 2025 and December 28, 2024, the Company entered into agreements to sell, on an ongoing basis and without recourse, certain trade accounts receivable. The buyer is responsible for servicing the receivables. The sale of the receivables is accounted for in accordance with Financial Accounting Standards Board (“FASB”) ASC 860, Transfers and Servicing. Under that guidance, receivables are considered sold when they are transferred beyond the reach of the Company and its creditors, the purchaser has the right to pledge or exchange the receivables, and the Company has surrendered control over the transferred receivables. The Company has received proceeds from the sales of trade accounts receivable of approximately $309,860 , $286,243 and $299,169 for the years ended December 27, 2025, December 28, 2024 and December 30, 2023, respectively, and has included the proceeds in net cash provided by operating activities in the Consolidated Statements of Cash Flows. Related to the sale of accounts receivable, the Company recorded losses of approximately $5,574 , $5,840 and $6,313 for the years ended December 27, 2025, December 28, 2024 and December 30, 2023, respectively.
Inventories:
Property and Equipment:
42| December 27, 2025 Form 10-K | ||||||||
Property and equipment, net, consists of the following at December 27, 2025 and December 28, 2024:
| Estimated Useful Life | |||||||||||||||||||||||
| (Years) | 2025 | 2024 | |||||||||||||||||||||
| Leasehold improvements | life of lease | $ | $ | ||||||||||||||||||||
| Machinery and equipment | - | ||||||||||||||||||||||
| Computer equipment and software | - | ||||||||||||||||||||||
| Furniture and fixtures | - | ||||||||||||||||||||||
| Construction in process | |||||||||||||||||||||||
| Property and equipment, gross | |||||||||||||||||||||||
| Less: Accumulated depreciation | |||||||||||||||||||||||
| Property and equipment, net | $ | $ | |||||||||||||||||||||
Goodwill:
The Company has adopted ASU 2017-04, Intangibles – Goodwill and Other (Topic 350): Simplifying the Test for Goodwill Impairment, which eliminates Step 2 from the goodwill impairment test and instead requires an entity to perform its annual, or interim, goodwill impairment test by comparing the fair value of a reporting unit with its carrying amount. If, after assessing the totality of events or circumstances, the Company determines that the fair value of a reporting unit is less than the carrying value, then the Company would recognize an impairment charge for the amount by which the carrying amount exceeds the reporting unit's fair value, not to exceed the total amount of goodwill allocated to the reporting unit.
Goodwill amounts by reportable segment are summarized as follows:
| Goodwill at | Goodwill at | |||||||||||||||||||||||||||||||
| December 28, 2024 | Acquisitions | Disposals | Other(1) | December 27, 2025 | ||||||||||||||||||||||||||||
| Hardware and Protective Solutions | $ | $ | $ | $ | $ | |||||||||||||||||||||||||||
| Robotics and Digital Solutions | ( | |||||||||||||||||||||||||||||||
| Canada | ||||||||||||||||||||||||||||||||
| Total | $ | $ | $ | $ | $ | |||||||||||||||||||||||||||
(1)The "Other" change to goodwill relates to adjustments resulting from fluctuations in foreign currency exchange rates for the Canada, Hardware Solutions, and Protective Solutions reporting units. "Other" also includes a reallocation of $10,580 of goodwill from our Robotics and Digital Solutions reporting unit to our Hardware Solutions reporting unit in connection with the segment realignment - see Note 18 - Segment Reporting and Geographic Information for additional information.
Intangible Assets:
Intangible assets arise primarily from the determination of their respective fair market values at the date of acquisition. With the exception of certain trade names, intangible assets are amortized on a straight-line basis over periods ranging from 2 to 20 years, representing the period over which the Company expects to receive future economic benefits from these assets.
Other intangibles, net, as of December 27, 2025 and December 28, 2024 consist of the following:
43| December 27, 2025 Form 10-K | ||||||||
| Useful Life (Years) | December 27, 2025 | December 28, 2024 | |||||||||||||||||||||
| Customer relationships | - | $ | $ | ||||||||||||||||||||
| Trademarks - indefinite | Indefinite | ||||||||||||||||||||||
| Trademarks - other | - | ||||||||||||||||||||||
| Technology and patents | - | ||||||||||||||||||||||
| Intangible assets, gross | |||||||||||||||||||||||
| Less: Accumulated amortization | |||||||||||||||||||||||
| Intangible assets, net | $ | $ | |||||||||||||||||||||
Estimated annual amortization expense for intangible assets subject to amortization at December 27, 2025 for the next five fiscal years is as follows:
| Fiscal Year Ended | Amortization Expense | |||||||
| 2026 | $ | |||||||
| 2027 | ||||||||
| 2028 | ||||||||
| 2029 | ||||||||
| 2030 | ||||||||
| Thereafter | ||||||||
Long-Lived Assets:
Long-lived assets, such as property and equipment and definite-lived intangible assets, are reviewed for impairment whenever events or circumstances indicate that the carrying amount of an asset may not be recoverable. If circumstances require a long-lived asset or asset group to be tested for possible impairment, the Company first compares undiscounted cash flows expected to be generated by the asset or asset group to its carrying value. If the carrying amount of the long-lived asset or asset group is not recoverable on an undiscounted cash flow basis, an impairment is recognized to the extent that the carrying amount exceeds its fair value. Fair value is determined through various valuation techniques including discounted cash flow models, quoted market values, and third-party independent appraisals, as considered necessary.
During fiscal 2023, the Company performed an impairment assessment on certain intangible assets. In the fourth quarter of 2023, we evaluated a specific product line and decided to exit certain retail locations and markets, which reduced the future cash flows from this product line and impacted the lower of cost or net realizable value of inventory. As a result, the Company recognized an impairment charge of $19.6 million during the fourth quarter of 2023 to write down the carrying values of intangible assets to their fair value. The Impairment charge was split between the following asset categories: $15.6 million for customer relationships, $2.2 million for technology and patents, and $1.7 million for trademarks - other. The impairment charge is included in other expense (income), net in the accompanying consolidated statements of comprehensive income (loss).
Income Taxes:
Deferred income taxes are computed using the asset and liability method. Under this method, deferred income taxes are recognized for temporary differences between the financial reporting basis and income tax basis of assets and liabilities, based on enacted tax laws and statutory tax rates applicable to the periods in which the
44| December 27, 2025 Form 10-K | ||||||||
temporary differences are expected to reverse. Valuation allowances are provided for tax benefits where management estimates it is more likely than not that certain tax benefits will not be realized. Adjustments to valuation allowances are recorded for changes in utilization of the tax-related item. See Note 6 - Income Taxes for additional information.
In December 2023, the Financial Accounting Standards Board (“FASB”) issued Accounting Standards Update (“ASU”) No. 2023-09, Improvements to Income Tax Disclosures (Topic 740). The ASU requires disaggregated information about a reporting entity’s effective tax rate reconciliation as well as additional information on income taxes paid. We adopted this ASU on a prospective basis effective December 29, 2024. Refer to Note 6 - Income Taxes for the inclusion of new disclosures required.
In accordance with guidance regarding the accounting for uncertainty in income taxes, the Company recognizes a tax position if, based solely on its technical merits, it is more likely than not to be sustained upon examination by the relevant taxing authority. If a tax position does not meet the more likely than not recognition threshold, the Company does not recognize the benefit of that position in its Consolidated Financial Statements. A tax position that meets the more likely than not recognition threshold is measured to determine the amount of benefit to be recognized in the Consolidated Financial Statements.
Interest and penalties related to income taxes are included in income tax expense for income taxes.
Contingent Consideration:
Contingent consideration relates to the potential payment for an acquisition that is contingent upon the achievement of the acquired business meeting certain product development milestones and/or certain financial performance milestones. The Company records contingent consideration at fair value at the date of acquisition based on the consideration expected to be transferred. The estimated fair value of the contingent consideration was determined using a Monte Carlo analysis examining the frequency and mean value of the resulting payments. The resulting value captures the risk associated with the form of the payout structure. The risk neutral method is applied, resulting in a value that captures the risk associated with the form of the payout structure and the projection risk. The assumptions utilized in the calculation based on financial performance milestones include projected revenue, volatility and discount rates. For potential payments related to product development milestones, we estimated the fair value based on the probability of achievement of such milestones. The assumptions utilized in the calculation of the acquisition date fair value include probability of success and the discount rates. Contingent consideration involves certain assumptions requiring significant judgment and actual results may differ from assumed and estimated amounts.
Risk Insurance Reserves:
The Company self-insures our general liability including products liability, automotive liability, and workers' compensation losses up to $500 per occurrence. Our policy is to estimate reserves based upon a number of factors, including known claims, estimated incurred but not reported claims, and third-party actuarial analysis. The third-party actuarial analysis is based on historical information along with certain assumptions about future events. These reserves are classified as other current and other long-term liabilities within the balance sheets.
The Company self-insures our group health claims up to an annual stop loss limit of $300 per participant. Historical group insurance loss experience forms the basis for the recognition of group health insurance reserves.
Retirement Benefits:
Certain employees of the Company are covered under a profit-sharing and retirement savings plan. The plan provides for a matching contribution for eligible employees of 50 % of each dollar contributed by the employee up to 6 % of the employee's compensation. In addition, the plan allows for an optional annual contribution in amounts authorized by the Board of Directors, subject to the terms and conditions of the plan.
Hillman Canada sponsors a Deferred Profit Sharing Plan (“DPSP”) and a Group Registered Retirement Savings Plan (“RRSP”) for all qualified, full-time employees, with at least three months of continuous service. DPSP is an employer-sponsored profit sharing plan registered as a trust with the Canada Revenue Agency (“CRA”). Employees do not contribute to the DPSP. There is no minimum required contribution; however, DPSPs are subject to maximum contribution limits set by the CRA. The DPSP is offered in conjunction with a RRSP. All eligible employees may contribute an additional voluntary amount of up to eight percent of the employee's gross earnings. Hillman Canada is required to match 100 % of all employee contributions up to 2 % of the employee's compensation into the DPSP account. The assets of the RRSP are held separately from those of Hillman Canada in independently administered funds.
45| December 27, 2025 Form 10-K | ||||||||
Revenue Recognition:
Revenue is recognized when control of goods or services is transferred to our customers, in an amount that reflects the consideration the Company expects to be entitled to in exchange for those goods or services. Sales and other taxes the Company collects concurrent with revenue-producing activities are excluded from revenue.
The Company offers a variety of sales incentives to its customers primarily in the form of discounts and rebates. Discounts are recognized in the Consolidated Financial Statements at the date of the related sale. Rebates are based on the revenue to date and the contractual rebate percentage to be paid. A portion of the cost of the rebate is allocated to each underlying sales transaction. Discounts and rebates are included in the determination of net sales.
The Company also establishes a reserve for customer returns and allowances. The reserve is established based on historical rates of returns and allowances. The reserve is adjusted quarterly based on actual experience. Discounts and allowances are included in the determination of net sales.
The following table disaggregates our revenue by product category. Certain amounts in the prior year presentation between segments were reclassified to conform to the current year’s presentation.
| Hardware and Protective Solutions | Robotics and Digital Solutions | Canada | Total Revenue | ||||||||||||||||||||
| Year Ended December 27, 2025 | |||||||||||||||||||||||
| Fastening and Hardware | $ | $ | $ | $ | |||||||||||||||||||
| Personal Protective | |||||||||||||||||||||||
| Keys and Key Fobs | |||||||||||||||||||||||
| Engraving and Resharp | |||||||||||||||||||||||
| Consolidated | $ | $ | $ | $ | |||||||||||||||||||
| Year Ended December 28, 2024 | |||||||||||||||||||||||
| Fastening and Hardware | $ | $ | $ | $ | |||||||||||||||||||
| Personal Protective | |||||||||||||||||||||||
| Keys and Key Fobs | |||||||||||||||||||||||
| Engraving and Resharp | |||||||||||||||||||||||
| Consolidated | $ | $ | $ | $ | |||||||||||||||||||
| Year Ended December 30, 2023 | |||||||||||||||||||||||
| Fastening and Hardware | $ | $ | $ | $ | |||||||||||||||||||
| Personal Protective | |||||||||||||||||||||||
| Keys and Key Fobs | |||||||||||||||||||||||
| Engraving and Resharp | |||||||||||||||||||||||
| Consolidated | $ | $ | $ | $ | |||||||||||||||||||
The following table disaggregates our revenue by geographic location:
46| December 27, 2025 Form 10-K | ||||||||
| Hardware and Protective Solutions | Robotics and Digital Solutions | Canada | Total Revenue | ||||||||||||||||||||
| Year Ended December 27, 2025 | |||||||||||||||||||||||
| United States | $ | $ | $ | $ | |||||||||||||||||||
| Canada | |||||||||||||||||||||||
| Mexico | |||||||||||||||||||||||
| Consolidated | $ | $ | $ | $ | |||||||||||||||||||
| Year Ended December 28, 2024 | |||||||||||||||||||||||
| United States | $ | $ | $ | $ | |||||||||||||||||||
| Canada | |||||||||||||||||||||||
| Mexico | |||||||||||||||||||||||
| Consolidated | $ | $ | $ | $ | |||||||||||||||||||
| Year Ended December 30, 2023 | |||||||||||||||||||||||
| United States | $ | $ | $ | $ | |||||||||||||||||||
| Canada | |||||||||||||||||||||||
| Mexico | |||||||||||||||||||||||
| Consolidated | $ | $ | $ | $ | |||||||||||||||||||
Our revenue by geography is allocated based on the location of our sales operations.
Hardware and Protective Solutions revenues consist primarily of the delivery of fasteners, anchors, specialty fastening products, rope and chain, and personal protective equipment such as gloves and eye-wear as well as accessories and in-store merchandising services for the related product category.
Robotics and Digital Solutions revenues consist primarily of sales of keys and identification tags through self-service key duplication and engraving kiosks. It also includes our associate-assisted key duplication systems.
Canada revenues consist primarily of the delivery to Canadian customers of fasteners and related hardware items, threaded rod, keys, key duplicating systems, accessories, personal protective equipment, and identification items as well as in-store merchandising services for the related product category.
The Company’s performance obligations under its arrangements with customers are providing products, in-store merchandising services, and access to key duplicating and engraving equipment. Generally, the price of the merchandising services and the access to the key duplicating and engraving equipment is included in the price of the related products. Control of products is transferred at the point in time when the customer accepts the goods, which occurs upon delivery of the products. Judgment is required in determining the time at which to recognize revenue for the in-store services and the access to key duplicating and engraving equipment. Revenue is recognized for in-store service and access to key duplicating and engraving equipment as the related products are delivered, which approximates a time-based recognition pattern. Therefore, the entire amount of consideration related to the sale of products, in-store merchandising services, and access to key duplicating and engraving equipment is recognized upon the delivery of the products.
The costs to obtain a contract are insignificant, and generally contract terms do not extend beyond one year. Therefore, these costs are expensed as incurred. Freight and shipping costs and the cost of our in-store merchandising services teams are recognized in selling, warehouse, general, and administrative expense when control over products is transferred to the customer.
The Company used the practical expedient regarding the existence of a significant financing component as payments are due in less than one year after delivery of the products.
47| December 27, 2025 Form 10-K | ||||||||
Shipping and Handling:
The costs incurred to ship product to customers, including freight and handling expenses, are included in selling, warehouse, general, and administrative (“SG&A”) expenses on the Company's Consolidated Statements of Comprehensive Income (Loss).
Shipping and handling costs were $55,038 , $53,438 , and $53,288 in the years ended December 27, 2025, December 28, 2024, and December 30, 2023, respectively.
Research and Development:
Stock-Based Compensation:
2021 Employee Stock Purchase Plan
Our Employee Stock Purchase Plan ("ESPP") became effective on July 14, 2021. A total of 2,140,754 shares of common stock are available for issuance under the ESPP. Under the ESPP, eligible employees are granted options to purchase shares of common stock at 85% of the fair market value at the time of exercise. The option period commences on the first payroll date in January, April, July, and October of each year and ends approximately three months later on the last business day in March, June, September or December. No employee may be granted an option under the Plan if, immediately after the option is granted, the employee would own stock possessing five percent or more of the total combined voting power or value of all classes of stock of the Company.
2021 Equity Incentive Plan
Effective July 14, 2021, the Company established the 2021 Equity Incentive Plan. Under the 2021 Equity Incentive Plan, the Company may grant options, stock appreciation rights, restricted stock, and other stock-based awards. Hillman reflects the options granted in accordance with Accounting Standards Codification 718, Compensation - Stock Compensation ("ASC 718"). The Company uses a Black-Scholes option pricing model to determine the fair value of stock options on the dates of grant. The Black-Scholes pricing model requires various assumptions, including expected term, which is based on our historical experience and expected volatility which is estimated based on the average historical volatility of similar entities with publicly traded shares. The Company also makes assumptions regarding the risk-free interest rate and the expected dividend yield. The risk-free interest rate is based on the U.S. Treasury interest rate whose term is consistent with the expected term of the share-based award. The dividend yield on our common stock is assumed to be zero since we do not pay dividends and have no current plans to do so in the future. Determining the fair value of stock options at the grant date requires judgment, including estimates for the expected life of the share-based award, stock price volatility, dividend yield, and interest rate. These assumptions may differ significantly between grant dates because of changes in the actual results of these inputs that occur over time.
HMAN Group Holdings Inc. 2014 Equity Incentive Plan
Prior to 2021, the Company had a stock-based employee compensation plan pursuant to which the Company granted options, stock appreciation rights, restricted stock, and other stock-based awards. Hillman reflects the options granted in its stand-alone Consolidated Financial Statements in accordance with Accounting Standards Codification 718, Compensation — Stock Compensation (“ASC 718”). The Company used a Black-Scholes option pricing model to determine the fair value of stock options on the dates of grant. The Black-Scholes pricing model requires various assumptions, including expected term, which is based on our historical experience and expected volatility which is estimated based on the average historical volatility of similar entities. The Company also made assumptions regarding the risk-free interest rate and the expected dividend yield. The risk-free interest rate is based on the U.S. Treasury interest rate whose term is consistent with the expected term of the share-based award. The dividend yield on our common stock is assumed to be zero since we have not historically paid dividends on these awards and have no current plans to do so in the future. Determining the fair value of stock options at the grant date requires judgment, including estimates for the expected life of the share-based award, stock price volatility, dividend yield, and interest rate. These assumptions may differ significantly between grant dates because of changes in the actual results of these inputs that occur over time.
48| December 27, 2025 Form 10-K | ||||||||
Stock-based compensation expense is recognized using a fair value based recognition method. Stock-based compensation cost is estimated at the grant date based on the fair value of the award and is recognized as expense over the requisite vesting period or performance period of the award on a straight-line basis. The stock-based compensation expense is recorded in selling, warehouse, general and administrative expenses. The plans are more fully described in Note 11 - Stock-Based Compensation.
Fair Value of Financial Instruments:
Derivatives and Hedging:
The Company uses derivative financial instruments to manage its exposures to (1) interest rate fluctuations on its floating rate senior term loan and (2) fluctuations in foreign currency exchange rates. The Company measures those instruments at fair value and recognizes changes in the fair value of derivatives in earnings in the period of change, unless the derivative qualifies as an effective hedge that offsets certain exposures. The Company enters into derivative instrument transactions with financial institutions acting as the counter-party. The Company does not enter into derivative transactions for speculative purposes and, therefore, holds no derivative instruments for trading purposes.
The relationships between hedging instruments and hedged items are formally documented, in addition to the risk management objective and strategy for each hedge transaction. For interest rate swaps, the notional amounts, rates, and maturities of our interest rate swaps are closely matched to the related terms of hedged debt obligations. The critical terms of the interest rate swap are matched to the critical terms of the underlying hedged item to determine whether the derivatives used for hedging transactions are highly effective in offsetting changes in the cash flows of the underlying hedged item. If it is determined that a derivative ceases to be a highly effective hedge, the hedge accounting is discontinued and all subsequent derivative gains and losses are recognized in the Statement of Comprehensive Income (Loss).
Derivative instruments designated in hedging relationships that mitigate exposure to the variability in future cash flows of the variable-rate debt and foreign currency exchange rates are considered cash flow hedges. The Company records all derivative instruments in other assets or other liabilities on the Consolidated Balance Sheets at their fair values. If the derivative is designated as a cash flow hedge and the hedging relationship qualifies for hedge accounting, the effective portion of the change in the fair value of the derivative is recorded in other comprehensive income or loss. The change in fair value for instruments not qualifying for hedge accounting are recognized in the Statement of Comprehensive Income (Loss) in the period of the change. See Note 13 - Derivatives and Hedging for additional information.
Share Repurchase Program:
Translation of Foreign Currencies:
The translation of the Company's Canadian and Mexican local currency based financial statements into U.S. dollars is performed for balance sheet accounts using exchange rates in effect at the balance sheet date and for revenue and expense accounts using an average exchange rate during the period. Cumulative translation adjustments are recorded as a component of accumulated other comprehensive income (loss) in stockholders' equity.
49| December 27, 2025 Form 10-K | ||||||||
Use of Estimates in the Preparation of Financial Statements:
The preparation of Consolidated Financial Statements in conformity with accounting principles generally accepted in the United States requires management to make estimates and assumptions that affect the reported amount of assets and liabilities and disclosure of contingent assets and liabilities at the date of the Consolidated Financial Statements and the reported amounts of revenues and expenses for the reporting period. Actual results may differ from these estimates.
3. RECENT ACCOUNTING PRONOUNCEMENTS
On December 14, 2023, the Financial Accounting Standards Board (FASB) issued Accounting Standards Update (ASU) 2023-09, Improvements to Income Tax Disclosures. The amendments in this update require that public business entities on an annual basis (1) disclose specific categories in the rate reconciliation and (2) provide additional information for reconciling items that meet a quantitative threshold. The standard requires disaggregated information about a reporting entity’s effective tax rate reconciliation as well as information on income taxes paid. The standard is intended to benefit investors by providing more detailed income tax disclosures that would be useful in making capital allocation decisions. The amendments on Income Tax Disclosures are effective for fiscal years beginning after December 15, 2024. We adopted this ASU on a prospective basis effective December 29, 2024. Refer to Note 6 - Income Taxes for the inclusion of new disclosures required.
On January 6, 2025, the FASB issued ASU 2025-01, Income Statement—Reporting Comprehensive Income—Expense Disaggregation Disclosures: Disaggregation of Income Statement Expenses, as an amendment to ASU 2024-03. This ASU mandates that public business entities provide detailed disclosures in the notes to their financial statements, breaking down certain expense categories presented on the income statement into specified natural expense components. This enhanced disclosure aims to provide investors with more detailed information about the types of expenses included in commonly presented expense captions, such as cost of sales, selling, general, and administrative expenses (SG&A), and research and development. The amendments introduced by ASU 2025-01 are effective for public business entities for fiscal years beginning after December 15, 2026 and for interim periods beginning after December 15, 2027 with early adoption permitted. The Company is currently evaluating the impact provided by the new standard.
In July 2025, the FASB issued ASU 2025-05, Financial Instruments-Credit Losses (Topic 326): Measurement of Credit Losses for Accounts Receivable and Contract Assets (ASU 2025-05), which provides a practical expedient to measure credit losses on current accounts receivable and current contract assets under Accounting Standards Codification 606, Revenue from Contracts with Customers. The practical expedient assumes that current conditions as of the balance sheet date do not change for the remaining life of the asset. For public business entities, ASU 2025-05 is effective for annual reporting periods beginning after December 15, 2025, and interim reporting periods within those annual reporting periods. Early adoption of ASU 2025-05 is permitted. The Company is currently evaluating the impact provided by the new standard.
In September 2025, the FASB issued ASU 2025-06, Intangibles—Goodwill and Other—Internal-Use Software (Subtopic 350-40): Targeted Improvements to the Accounting for Internal-Use Software, which is intended to modernize the accounting for the costs of internal-use software. The amendments remove all references to prescriptive and sequential development stages and, instead, require an entity to start capitalizing software costs when management has authorized and committed to funding the software project, and it is probable that the project will be completed and the software will be used to perform the function intended. The amendments are effective for annual reporting periods beginning after December 15, 2027, and interim reporting periods within those annual reporting periods. Early adoption is permitted as of the beginning of an annual reporting period with the amendments to be applied using a prospective, modified or retrospective transition approach. The Company is currently evaluating the impact provided by the new standard.
In December 2025, the FASB issued ASU 2025-11, Interim Reporting (Topic 270): Narrow-Scope Improvements which is intended to clarify existing requirements without fundamentally altering interim reporting or changing existing disclosure requirements. Key aspects include clarifying that ASC 270 applies to entities providing a full set of GAAP interim financial statements and notes, centralizing a list of all required interim disclosures from other ASC topics within Topic 270, and codifying a principle requiring disclosure of material events and changes since the most recent annual report. The amendments in this update are effective for interim reporting periods within annual reporting periods beginning after December 15, 2027. The Company is currently evaluating the impact provided by the new standard.
4. RELATED PARTY TRANSACTIONS
50| December 27, 2025 Form 10-K | ||||||||
Hillman, Jefferies Financial Group Inc., certain other financial sponsors, certain CCMP affiliated investors and certain Oak Hill affiliated investors entered into the Amended and Restated Registration Rights Agreement (the “A&R Registration Rights Agreement”), pursuant to which, among other things, the parties to the A&R Registration Rights Agreement agreed not to effect any sale or distribution of any equity securities of Hillman held by any of them during the lock-up period described therein and were granted certain registration rights with respect to their respective shares of Hillman common stock, in each case, on the terms and subject to the conditions therein. Richard Zannino and Joe Scharfenberger, both partners at CCMP, were members of our Board at the time Hillman entered into the A&R Registration Rights Agreement. Mr. Zannino and Mr. Scharfenberger each resigned from the Hillman Board in May 2023 following CCMP's complete exit of its investment in Hillman during the second quarter of 2023. Another director, Teresa Gendron, was the CFO of Jefferies Financial Group Inc. until March 2023.
Sales to related parties, which are included in net sales, consist primarily of the sale of excess inventory to Ollie's Bargain Outlet Holdings, Inc. ("Ollie's"). John Swygert, Executive Chairman of Ollie's since 2025, and before that President and Chief Executive Officer of Ollie's, is a member of our Board of Directors. Sales to related parties were $312 , $622 , and $1,583 for the years ended December 27, 2025, December 28, 2024, and December 30, 2023, respectively.
In late 2024, the Company signed a contract with Ollie's to place Minute Key and Quick-Tag machines in select Ollie's locations. The Company paid royalties shares to Ollie's as a result of this agreement. The payments to related parties were immaterial in the years ended December 27, 2025 and December 28, 2024, respectively.
5. ACQUISITIONS
Ajustlock
On December 5, 2023, the Company completed its acquisition of Ajustlock, an innovative adjustable barrel bolt lock used on gates, doors or windows which self-adjusts vertically to eliminate door shift issues, for a total purchase price of $1,400 , which includes a $100 hold-back payable to the seller due one year after closing. During the fourth quarter of 2024, the remaining hold-back of $54, which reflects the balance owed to Ajustlock after deducting certain amounts owed by Ajustlock to the Company, was paid to satisfy the full purchase price. Ajustlock sells its products throughout North America and its financial results reside in the Company's Hardware and Protective Solutions reportable segment and have been determined to be immaterial for purposes of additional disclosure.
Koch Industries, Inc.
On January 11, 2024, the Company completed the acquisition of Koch Industries, Inc. ("Koch"), a premier provider and merchandiser of rope and twine, chain and wire rope, and related hardware products for a total purchase price of $23,783 . In the second quarter of 2024, the Company had a final net working capital adjustment of $173, which reduced goodwill and the purchase price of the acquisition from an estimated $23,956 at closing in the first quarter of 2024 to $23,783 . Koch has business operations throughout North America and its financial results reside in the Company's Hardware and Protective Solutions reportable segment.
The following table reconciles the fair value of the acquired assets and assumed liabilities to the total purchase price of Koch.
| Inventory | $ | ||||
| Other current assets | |||||
| Property and equipment | |||||
| Goodwill | |||||
| Customer relationships | |||||
| Trade names | |||||
| Total assets acquired | $ | ||||
| Less: | |||||
| Liabilities assumed | ( | ||||
| Total purchase price | $ | ||||
Net sales and operating income from Koch included in the Company's Condensed Consolidated Statement of Comprehensive Income (Loss) for the year ended December 27, 2025 were as follows:
51| December 27, 2025 Form 10-K | ||||||||
| Year Ended December 27, 2025 | Year Ended December 28, 2024 | |||||||
| Net sales | $ | $ | ||||||
| Operating income | ||||||||
Pro forma financial information has not been presented for Koch as the financial results of Koch were insignificant to the financial results of the Company on a standalone basis.
Intex DIY, Inc.
On August 23, 2024, the Company completed the acquisition of Intex DIY, Inc. ("Intex"), a leading supplier of wiping cloths, consumable rags, and cleaning textiles for a total purchase price of $34,064 . This acquisition expands Hillman’s offerings in the cleaning products category. Intex has business operations throughout North America and its financial results reside in the Company's Hardware and Protective Solutions reportable segment.
The following table reconciles the fair value of the acquired assets and assumed liabilities to the total purchase price of Intex.
| Accounts receivable | $ | ||||
| Inventory | |||||
| Other current assets | |||||
| Property and equipment | |||||
| Goodwill | |||||
| Customer relationships | |||||
| Trade names | |||||
| Total assets acquired | $ | ||||
| Less: | |||||
| Liabilities assumed | ( | ||||
| Total purchase price | $ | ||||
Net sales and operating income from Intex included in the Company's Condensed Consolidated Statement of Comprehensive Income (Loss) for the year ended December 27, 2025 were as follows:
| Year Ended December 27, 2025 | Year Ended December 28, 2024 | |||||||
| Net sales | $ | $ | ||||||
| Operating income | ||||||||
Pro forma financial information has not been presented for Intex as the financial results of Intex were insignificant to the financial results of the Company on a standalone basis.
6. INCOME TAXES
Income (loss) before income taxes are comprised of the following components for the periods indicated:
| Year Ended December 27, 2025 | Year Ended December 28, 2024 | Year Ended December 30, 2023 | |||||||||||||||
| United States based operations | $ | $ | $ | ( | |||||||||||||
| Non-United States based operations | |||||||||||||||||
| Income (loss) before income taxes | $ | $ | $ | ( | |||||||||||||
52| December 27, 2025 Form 10-K | ||||||||
Below are the components of the Company's income tax expense for the periods indicated:
| Year Ended December 27, 2025 | Year Ended December 28, 2024 | Year Ended December 30, 2023 | |||||||||||||||
| Current: | |||||||||||||||||
| Federal | $ | $ | $ | ||||||||||||||
| State | |||||||||||||||||
| Foreign | |||||||||||||||||
| Total current | |||||||||||||||||
| Deferred: | |||||||||||||||||
| Federal | ( | ( | |||||||||||||||
| State | ( | ( | ( | ||||||||||||||
| Foreign | ( | ( | ( | ||||||||||||||
| Total deferred | ( | ( | |||||||||||||||
| Valuation allowance | ( | ||||||||||||||||
| Income tax expense | $ | $ | $ | ||||||||||||||
The Company has U.S. federal net operating loss (“NOL”) carryforwards totaling $3,340 as of December 27, 2025 that are available to offset future taxable income. All of the remaining U.S. federal NOLs were acquired with the MinuteKey purchase in 2018. The MinuteKey NOLs are subject to limitation under IRC §382 from current and prior ownership changes. Management anticipates utilizing all remaining U.S. federal NOLs evenly through 2032 in accordance with the IRC §382 limitation.
The Company has state NOL carryforwards with an aggregate tax benefit of $1,398 which expire from 2026 to 2040.
The table below reflects the significant components of the Company's net deferred tax assets and liabilities at December 27, 2025 and December 28, 2024:
| December 27, 2025 | December 28, 2024 | |||||||||||||
| Non-current | Non-current | |||||||||||||
| Deferred Tax Asset: | ||||||||||||||
| Inventory | $ | $ | ||||||||||||
| Accrued bonus / deferred compensation | ||||||||||||||
| Interest limitation | ||||||||||||||
| Lease liabilities | ||||||||||||||
| All other | ||||||||||||||
| Gross deferred tax assets | ||||||||||||||
| Valuation allowance for deferred tax assets | ( | ( | ||||||||||||
| Net deferred tax assets | $ | $ | ||||||||||||
| Deferred Tax Liability: | ||||||||||||||
| Intangible asset amortization | $ | $ | ||||||||||||
| Property and equipment | ||||||||||||||
| Lease assets | ||||||||||||||
| All other items | ||||||||||||||
| Deferred tax liabilities | $ | $ | ||||||||||||
| Net deferred tax liability | $ | $ | ||||||||||||
Realization of the net deferred tax assets is dependent on the reversal of deferred tax liabilities. Although realization is not assured, management estimates it is more likely than not that the net deferred tax assets will be realized. The amount of net deferred tax assets considered realizable, however, could be reduced in the near term if estimates of future taxable income during the carryforward periods are reduced.
53| December 27, 2025 Form 10-K | ||||||||
The Company no longer asserts permanent reinvestment of foreign subsidiary earnings and now expects to distribute certain foreign earnings as needed. Undistributed earnings of our foreign subsidiaries are subject to certain taxes upon repatriation, primarily where foreign withholding taxes apply. As of December 27, 2025, the Company recorded a deferred tax liability of $125 on the undistributed earnings of its Canadian subsidiary.
A reconciliation of the provision for income taxes to the amount computed by applying the 21% statutory U.S. federal income tax rate to income before income taxes after the adoption of ASU 2023-09 is as follows:
| Year Ended December 27, 2025 | ||||||||||||||
| Amount | Percent | |||||||||||||
| US Federal Statutory Tax Rate | $ | % | ||||||||||||
State and Local Income Taxes (Net of Federal Effect) (1) | % | |||||||||||||
| Foreign Tax Effects | % | |||||||||||||
| Effect of Cross-Border Tax Laws | ( | ( | % | |||||||||||
| Tax Credits | ||||||||||||||
| Research & Development Credits | ( | ( | % | |||||||||||
| Other | ( | % | ||||||||||||
| Nontaxable or Nondeductible Items | ||||||||||||||
| Non-deductible executive compensation | % | |||||||||||||
| Other | % | |||||||||||||
| Other Adjustments | % | |||||||||||||
| Effective income tax rate | $ | % | ||||||||||||
(1) State taxes in California, Florida, Georgia, Oregon, Pennsylvania and Texas made up the majority (greater than 50%) of the tax effect in this category.
A reconciliation of the provision for income taxes to the amount computed by applying the 21% statutory U.S. federal income tax rate to income before income taxes for years prior to the adoption of ASU 2023-09 is as follows:
| Year Ended December 28, 2024 | Year Ended December 30, 2023 | ||||||||||
| Statutory federal income tax rate | % | % | |||||||||
| Non-U.S. taxes | % | ( | % | ||||||||
| State and local income taxes, net of U.S. federal income tax benefit | % | % | |||||||||
| Acquisition and related transaction costs | % | ( | % | ||||||||
| Meals & entertainment | % | ( | % | ||||||||
| Withholding taxes | % | ( | % | ||||||||
| Impact of foreign currency | % | % | |||||||||
| Reconciliation of tax provision to return | ( | % | ( | % | |||||||
| Non-deductible compensation | % | ( | % | ||||||||
| Reconciliation of other adjustments | % | ( | % | ||||||||
| Effective income tax rate | % | ( | % | ||||||||
54| December 27, 2025 Form 10-K | ||||||||
Cash paid for income taxes, net of refunds received, by jurisdiction pursuant to the disclosure requirements of ASU 2023-09 for the year ended December 27, 2025 is as follows:
Year Ended December 27, 2025 | |||||
| Federal | $ | ||||
| State and local | |||||
| California | |||||
| Other | |||||
| Foreign | |||||
| Canada | |||||
| Mexico | |||||
| Income taxes, net of amounts refunded | $ | ||||
The amount of cash income taxes paid, net of amounts refunded, during the years ended December 28, 2024 and December 30, 2023 was $9,622 and $5,356, respectively.
The Company has recently become a cash taxpayer for U.S. Federal income tax purposes due to the utilization of NOL carryforwards and general business credit carryforwards. Previously, unrecognized tax benefits were recorded as reductions to the associated deferred tax assets, which were offset by valuation allowances. Because the Company is now a Federal cash taxpayer and no longer has sufficient NOLs or credit carryforwards to offset potential disallowances, the Company reclassified the portion of its unrecognized tax benefits that had been previously netted against deferred tax assets. These amounts were transferred to a liability on the Consolidated Balance Sheets. The Company's reserve for unrecognized tax benefits increased for the year ended December 27, 2025 due to the reclassification and an increase in accrued interest and penalties. A balance of $1,690 of unrecognized tax benefit is shown in the financial statements at December 27, 2025 as a liability.
The following is a summary of the changes for the periods indicated below:
| Year Ended December 27, 2025 | Year Ended December 28, 2024 | Year Ended December 30, 2023 | ||||||||||||||||||
| Unrecognized tax benefits - beginning balance | $ | $ | $ | |||||||||||||||||
| Gross increases - tax positions in current period | ||||||||||||||||||||
| Reclassification from valuation allowance | 338 | — | — | |||||||||||||||||
| Gross increases - tax positions in prior period | ||||||||||||||||||||
| Gross decreases - tax positions in prior period | ||||||||||||||||||||
| Unrecognized tax benefits - ending balance | $ | $ | $ | |||||||||||||||||
| Amount of unrecognized tax benefit that, if recognized would affect the Company's effective tax rate | $ | $ | $ | |||||||||||||||||
The Company files a consolidated income tax return in the U.S. and numerous consolidated and separate income tax returns in various states and foreign jurisdictions. There are no significant audits for the period ended December 27, 2025. In general, our income tax returns for the years from 2011 through the current year remain open to examination by federal and state taxing authorities. In addition, our tax years of 2015 through current year remain open and subject to examination by tax authorities in certain foreign jurisdictions in which we have operations.
7. LONG-TERM DEBT
55| December 27, 2025 Form 10-K | ||||||||
The following table summarizes the Company’s debt:
| December 27, 2025 | December 28, 2024 | ||||||||||
| Revolving loans | $ | $ | |||||||||
| Senior Term Loan, due 2028 | |||||||||||
| Finance leases & other obligations | |||||||||||
| $ | $ | ||||||||||
| Unamortized discount on Senior Term Loan | ( | ( | |||||||||
| Current portion of long term debt and finance leases | ( | ( | |||||||||
| Deferred financing fees | ( | ( | |||||||||
| Total long term debt, net | $ | $ | |||||||||
Revolving Loans and Term Loans
As of December 27, 2025, the ABL Revolver had an outstanding balance of $36,000 , and had outstanding letters of credit of $3,268 . The Company has $279,144 of available borrowings under the revolving credit facility as a source of liquidity as of December 27, 2025 based on the customary asset-backed loan borrowing base and availability provisions.
In the third quarter of 2025, the Company amended its ABL Revolver to transition certain collateral requirements previously satisfied through letters of credit to a customs bond program. Prior to this replacement, these letters of credit were issued under the ABL Revolver and reduced the available borrowing capacity thereunder. Following the transition, the restricted capacity was released, increasing the Company’s total available borrowing capacity under the ABL Revolver by approximately $38.0 million. As of December 27, 2025, there was $3,268 letters of credit outstanding under the facility.
In October 2024 and August 2023, the Company made a $100.0 million and $80.0 million prepayment against the outstanding term loan balance without payment of a premium or penalty, respectively.
The aggregate commitment under the asset-based revolving credit agreement (the “ABL Revolver") is $375,000. Portions of the ABL Agreement are separately available for borrowing by the Company's United States subsidiary and Canadian subsidiary for $325,000 and $50,000, respectively. The interest rate for the ABL Revolver is, at the discretion of the Company, adjusted SOFR (or Term Canadian Overnight Repo Rate Average ("CORRA") in the case of Canadian Dollar loans) plus a margin varying from 1.25% to 1.75% per annum based on availability or an alternate base rate (or a Canadian prime rate or alternate base rate in the case of Canadian Dollar loans), plus a margin varying from 0.25% to 0.75% per annum based on availability, plus a 0.10% credit spread adjustment. The stated maturity date of the revolving credit commitments under the ABL Credit Agreement is July 29, 2027. The loans and other amounts outstanding under the ABL Credit Agreement and related documents are guaranteed by Hillman Solutions Corp., and, subject to certain exceptions, the Borrower’s wholly-owned domestic subsidiaries and are secured by substantially all of the Borrower’s and the guarantors’ assets plus, solely in the case of the Canadian Borrower, its and its wholly-owned Canadian subsidiary’s assets, which is guaranteed by the Canadian portion under the ABL Credit Agreement.
The interest rate for the term loan, after giving effect to the 2024 Repricing Amendment and 2025 Repricing Amendment described below, at the discretion of the Company, is (i) term SOFR plus a margin of 2.00%; or (ii) an alternate base rate plus a margin of 1.00%.
2024 Term Loan Repricing
On March 26, 2024, the Company entered into a Repricing Amendment (2024 Repricing Amendment) on its existing Senior Term Loan due July 14, 2028. The 2024 Repricing Amendment (i) reduced the interest rate per annum applicable to the Term Loan outstanding from SOFR plus a margin varying from 2.5 % to 2.75 % plus a Credit Spread Adjustment ("CSA") varying between 0.11 % to 0.43 % to SOFR plus a margin varying from 2.25 % to 2.50 %, without the CSA and (ii) implemented a 1% prepayment premium for the existing Term Loan to apply to Repricing Transactions that occur within six months after the effective date of the 2024 Repricing Amendment. In connection with the closing of the 2024 Repricing Amendment, the Company expensed $3,008 consisting of $1,554 of existing fees written off and $1,454 in new fees expensed. The Company capitalized an additional $33 primarily for the payment of upfront lender fees (original issue discount).
2025 Term Loan Repricing
56| December 27, 2025 Form 10-K | ||||||||
On January 14, 2025, the Company entered into a Repricing Amendment (2025 Repricing Amendment) on its existing Senior Term Loan due July 14, 2028. The 2025 Repricing Amendment (i) reduced the interest rate per annum applicable to the Term Loan outstanding from SOFR plus a margin varying from 2.25 % to 2.50 % to SOFR plus a margin of 2.00 %, as well as a 1.00 % margin for ABR Loans and (ii) implemented a 1% prepayment premium for the existing Term Loan to apply to Repricing Transactions that occur within six months after the effective date of the 2025 Repricing Amendment. In connection with the closing of the 2025 Repricing Amendment, the Company expensed $906 of new fees.
The aggregate minimum principal maturities of the long-term debt obligations for each of the five years following December 27, 2025 are as follows:
| Year | Amount | |||||||
| 2026 | $ | |||||||
| 2027 | ||||||||
| 2028 | ||||||||
| 2029 | ||||||||
| 2030 | ||||||||
| Thereafter | ||||||||
| Total | $ | |||||||
Note that future finance lease payments were excluded from the maturity schedule above. Refer to Note 8 - Leases.
8. LEASES
Lessee
The Company determines if a contract is or contains a lease at inception or modification of a contract. A contract is or contains a lease if the contract conveys the right to control the use of an identified asset for a period in exchange for consideration. Control over the use of the identified asset means the lessee has both 1) the right to obtain substantially all of the economic benefits from the use of the asset and 2) the right to direct the use of the asset. The Company leases certain distribution center locations, vehicles, forklifts, computer equipment, and its corporate headquarters with expiration dates through 2042. Certain lease arrangements include escalating rent payments and options to extend the lease term. Expected lease terms include these options to extend or terminate the lease when it is reasonably certain the Company will exercise the option. The Company's leasing arrangements do not contain material residual value guarantees nor material restrictive covenants.
The components of operating and finance lease costs for the years ended December 27, 2025, December 28, 2024 and December 30, 2023 were as follows:
| Year Ended December 27, 2025 | Year Ended December 28, 2024 | Year Ended December 30, 2023 | ||||||||||||||||||
| Operating lease costs | $ | $ | $ | |||||||||||||||||
| Short term lease costs | ||||||||||||||||||||
| Variable lease costs | ||||||||||||||||||||
| Finance lease costs: | ||||||||||||||||||||
| Amortization of right of use assets | ||||||||||||||||||||
| Interest on lease liabilities | ||||||||||||||||||||
Rent expense is recognized on a straight-line basis over the expected lease term. Rent expense totaled $27,972 , $27,717 and $27,832 in the years ended December 27, 2025, December 28, 2024 and December 30, 2023, respectively. Rent expense includes operating lease cost as well as expense for non-lease components such as common area maintenance, real estate taxes, real estate insurance, variable costs related to our leased vehicles and also short-term rental expenses.
The implicit rate is not determinable in most of the Company’s leases, as such management uses the Company’s incremental borrowing rate based on the information available at the commencement date in determining the present value of future payments. The weighted average remaining lease terms and discount rates for all of our operating leases as of December 27, 2025 and December 28, 2024 were as follows:
57| December 27, 2025 Form 10-K | ||||||||
| December 27, 2025 | December 28, 2024 | |||||||||||||||||||||||||
| Operating Leases | Finance Leases | Operating Leases | Finance Leases | |||||||||||||||||||||||
| Weighted average remaining lease term | ||||||||||||||||||||||||||
| Weighted average discount rate | ||||||||||||||||||||||||||
Supplemental balance sheet information related to the Company's finance leases as of December 27, 2025 and December 28, 2024:
| December 27, 2025 | December 28, 2024 | |||||||||||||
| $ | $ | |||||||||||||
| Total principal payable on finance leases | $ | $ | ||||||||||||
Supplemental cash flow information related to our operating leases was as follows for the years ended December 27, 2025 and December 28, 2024:
| Year Ended December 27, 2025 | Year Ended December 28, 2024 | |||||||||||||
| Cash paid for amounts included in the measurement of lease liabilities: | ||||||||||||||
| Operating cash outflow from operating leases | $ | $ | ||||||||||||
| Operating cash outflow from finance leases | ||||||||||||||
| Financing cash outflow from finance leases | ||||||||||||||
As of December 27, 2025, our future minimum rental commitments are immaterial for lease agreements beginning after the current reporting period. Maturities of our lease liabilities for all operating and finance leases are as follows as of December 27, 2025:
| Operating Leases | Finance Leases | |||||||||||||
| Less than one year | $ | $ | ||||||||||||
| 1 to 2 years | ||||||||||||||
| 2 to 3 years | ||||||||||||||
| 3 to 4 years | ||||||||||||||
| 4 to 5 years | ||||||||||||||
| After 5 years | ||||||||||||||
| Total future minimum rental commitments | ||||||||||||||
| Less - amounts representing interest | ( | ( | ||||||||||||
| Present value of lease liabilities | $ | $ | ||||||||||||
In July 2025, the Company entered into two additional operating leases which have not yet commenced; one is for an expansion project at the existing Bakersfield, California location, the second lease is for a new property located in Forest Park, Ohio for the purpose of consolidating office, warehouse, and distribution in the Cincinnati area. Occupancy has not yet commenced for either lease. The estimated future minimum rental commitments are approximately $407 per annum for the Bakersfield, California location beginning in 2026. The estimated future minimum rental commitments for the Forest Park lease are approximately $4.5 million per year beginning in late summer 2027, depending on substantial completion, and increasing 3.25 % per year thereafter for 15 years, which gives the lease an estimated ending term in 2042.
Lessor
58| December 27, 2025 Form 10-K | ||||||||
The Company has certain arrangements for key duplication equipment under which we are the lessor. These leases meet the criteria for operating lease classification. Lease income associated with these leases is not material.
9. DEFERRED COMPENSATION PLAN
The Company maintains a deferred compensation plan for key employees (the “Nonqualified Deferred Compensation Plan” or “NQDC”). The NQDC was frozen at the end of fiscal 2021 such that the NQDC does not allow new contributions. The NQDC previously allowed eligible employees to defer up to 25% of salary and commissions and up to 100% of bonuses. Prior to 2021, the Company contributed a matching contribution of 25% on the first $10 of employee deferrals, subject to a five-year vesting schedule.
As of December 27, 2025 and December 28, 2024, the Company's Consolidated Balance Sheets included $847 and $796 , respectively, in restricted investments representing the assets held in mutual funds to fund deferred compensation liabilities owed to the Company's current and former employees. The current portion of the restricted investments was $15 and $17 as of December 27, 2025 and December 28, 2024, respectively, and is included in other current assets on the accompanying Consolidated Balance Sheets. The assets held in the NQDC are classified as an investment in trading securities, accordingly, the investments are marked-to-market, see Note 14 - Fair Value Measurements for additional detail.
During the years ended December 27, 2025, December 28, 2024, and December 30, 2023, distributions from the deferred compensation plan aggregated $67 , $184 , and $537 , respectively.
10. EQUITY AND ACCUMULATED OTHER COMPREHENSIVE LOSS
Common Stock
Hillman Solutions Corp. has one class of common stock.
Share Repurchases
On July 31, 2025, the Board of Directors of the Company authorized a share repurchase program of up to $100,000 (the “Repurchase Program”) of the Company's common stock. The Repurchase Program permits shares of common stock to be repurchased from time to time at management's discretion, through a variety of methods, including a 10b5-1 trading plan, open market purchases, privately negotiated transactions or transactions otherwise in compliance with Rule 10b-18 under the Securities Exchange Act of 1934, as amended.
The timing and number of shares of common stock repurchased will be opportunistic depending on a variety of factors, including price, general business and market conditions, alternative investment opportunities and funding considerations. The Repurchase Program does not obligate the Company to repurchase any specific number of shares of common stock and may be suspended or discontinued at any time.
The following table presents information about our repurchases of common stock, all of which were completed through open market purchases (amounts in thousands):
| Year Ended December 27, 2025 | ||||||||
| Total number of shares repurchased | ( | |||||||
Total cost of shares repurchased (1) | $ | ( | ||||||
(1) Effective January 1, 2023, the Company’s share repurchases are subject to a 1% excise tax as a result of the Inflation Reduction Act of 2022. Excise taxes incurred on share repurchases represent direct costs of the repurchase and are recorded as a part of the cost basis of the shares within treasury stock.
The cost of shares repurchased may differ from the repurchases of common stock amounts in the consolidated statements of cash flows due to unsettled share repurchases at the end of a period and excise taxes incurred on share repurchases.
Stock Rollforward
59| December 27, 2025 Form 10-K | ||||||||
The following table presents a reconciliation of the number of shares of our common stock outstanding (amounts in thousands).
Common Stock (Shares) | Treasury Stock (Shares) | Total Net Shares Outstanding | ||||||||||||||||||
Balance at December 31, 2022 | 0 | |||||||||||||||||||
| Stock option activity, stock awards and employee stock purchase plan | 0 | |||||||||||||||||||
| Repurchases of common stock | 0 | 0 | ||||||||||||||||||
Balance at December 30, 2023 | ||||||||||||||||||||
| Stock option activity, stock awards and employee stock purchase plan | 0 | |||||||||||||||||||
| Repurchases of common stock | 0 | 0 | ||||||||||||||||||
Balance at December 28, 2024 | ||||||||||||||||||||
| Stock option activity, stock awards and employee stock purchase plan | 0 | |||||||||||||||||||
| Repurchases of common stock | 0 | ( | ( | |||||||||||||||||
| Balance at December 27, 2025 | ( | |||||||||||||||||||
Accumulated Other Comprehensive Loss
The following is the detail of the change in the Company's accumulated other comprehensive loss from December 31, 2022 to December 27, 2025 including the effect of significant reclassifications out of accumulated other comprehensive loss (net of tax):
| Accumulated Other Comprehensive Loss | |||||
| Balance at December 31, 2022 | $ | ( | |||
| Other comprehensive income before reclassifications | |||||
| Amounts reclassified from other comprehensive income¹ | ( | ||||
| Net current period other comprehensive loss | ( | ||||
| Balance at December 30, 2023 | ( | ||||
| Other comprehensive loss before reclassifications | ( | ||||
Amounts reclassified from other comprehensive loss² | |||||
| Net current period other comprehensive loss | ( | ||||
| Balance at December 28, 2024 | ( | ||||
| Other comprehensive income before reclassifications | |||||
Amounts reclassified from other comprehensive income3 | ( | ||||
| Net current period other comprehensive income | |||||
| Balance at December 27, 2025 | $ | ( | |||
(1)For the year ended December 30, 2023, the Company deferred a gain of $125 , reclassified a gain of $15,608 , including tax expense of $3,886 into other comprehensive loss due to hedging activities. The amounts reclassified out of other comprehensive loss were recorded as interest expense. See Note 13 - Derivatives and Hedging for additional information on the interest rate swaps.
(2)For the year ended December 28, 2024, the Company deferred a loss of $8162 , reclassified a loss of $11,680 including a tax benefit of $883 into other comprehensive loss due to hedging activities. The amounts reclassified out of other comprehensive loss were recorded as interest expense. See Note 13 - Derivatives and Hedging for additional information on the interest rate swaps.
(3)For the year ended December 27, 2025, the Company deferred a loss of $1,956 , reclassified a gain of $2,052 including tax expense of $1,002 into other comprehensive loss due to hedging activities. The amounts reclassified out of other comprehensive loss were recorded as interest expense. See Note 13 - Derivatives and Hedging for additional information on the interest rate swaps.
11. STOCK-BASED COMPENSATION
60| December 27, 2025 Form 10-K | ||||||||
HMAN Group Holdings Inc. 2014 Equity Incentive Plan
The Company's former parent, HMAN Group Holdings Inc., established the 2014 Equity Incentive Plan (the “Prior Plan”) in 2014. The Company merged with a special purpose acquisition corporation on July 14, 2021 and began trading on The Nasdaq Capital Market. At that time, share awards under the Prior Plan were converted and modified to reflect share awards of the Company's common stock.
The Company is no longer granting new awards under the 2014 Equity Incentive Plan. Awards previously granted under the 2014 Equity Incentive Plan include options, restricted stock, and other stock-based awards for up to an aggregate of 14,523,510 shares of its common stock.
The following table summarizes the key assumptions used in the valuation model for valuing the Company's stock compensation awards under the 2014 Equity Incentive Plan:
| Dividend yield | ||||||||||||||
| Risk free interest rate | % | - | % | |||||||||||
| Expected volatility | ||||||||||||||
| Expected terms | ||||||||||||||
Stock Options
The fair value of stock options is determined at the grant date using the Black-Scholes option pricing model. The time-based stock option awards generally vest evenly over four years from the grant date and performance-based options vest based on specified targets such as Company performance and Company stock price hurdles.
A summary of the stock option activity under the 2014 Equity Inventive Plan for the year ended December 27, 2025 is presented below (share amounts in thousands):
| Number of Shares | Weighted Avg. Exercise Price per Share (in whole dollars) | Weighted Avg. Remaining Contractual Term | ||||||||||||||||||
Outstanding at December 28, 2024 | $ | |||||||||||||||||||
| Granted | ||||||||||||||||||||
| Exercised | ( | |||||||||||||||||||
| Forfeited or expired | ( | |||||||||||||||||||
Outstanding at December 27, 2025 | $ | |||||||||||||||||||
Exercisable at December 27, 2025 | $ | |||||||||||||||||||
In fiscal years ended December 27, 2025, December 28, 2024 and December 30, 2023, 161 , 1,284 , and 77 options were exercised, respectively.
Stock option compensation expense of $73 , $1,546 , and $3,504 was recognized in the accompanying Consolidated Statements of Comprehensive Income (Loss) for the years ended December 27, 2025, December 28, 2024, and December 30, 2023, respectively. For the year ended, December 27, 2025, there was no unrecognized compensation expense for stock options, as all compensation related to the Prior Plan was fully expensed in 2025.
The total intrinsic value of share options exercised during the years ended 2025, 2024, and 2023 was $390 , $3,409 , and $162 , respectively.
Restricted Stock Awards
The Company granted restricted stock at the grant date fair value of the underlying common stock securities. The restrictions lapse in one quarter increments on each of the three anniversaries of the award date, and one quarter on the completion of the relocation of the recipient to the Cincinnati area or earlier in the event of a change in control. The associated expense is recognized over the service period.
There were no restricted stock award activity under the 2014 Equity Incentive Plan for the years ended December 27, 2025, December 28, 2024 or December 30, 2023.
Restricted Stock Units
61| December 27, 2025 Form 10-K | ||||||||
The Restricted Stock Units ("RSUs") granted to employees for service generally vest after three years, subject to continued employment.
There were no RSU activity under the 2014 Equity Incentive Plan for the year ended December 27, 2025.
Restricted stock unit compensation expense of $55 and $582 was recognized in the accompanying Consolidated Statements of Comprehensive Income (Loss) for the fiscal years ended December 28, 2024 and December 30, 2023, respectively.
2021 Equity Incentive Plan
Effective July 14, 2021, the Company established the 2021 Equity Incentive Plan. On June 7, 2024, the 2021 Equity Incentive Plan was amended to increase the share reserve by 2,000,000 shares of common stock (the 2021 Equity Incentive Plan as amended is referred to as the “2021 Plan”). On June 3, 2025, the 2021 Equity Incentive Plan was amended to increase the share reserve by 1,800,000 shares of common stock (the 2021 Equity Incentive Plan as amended is referred to as the “2021 Plan”). Under the 2021 Plan, the maximum number of shares of Stock that may be delivered in satisfaction of Awards under the Plan as of the Effective Date is (i) 10,950,814 shares, plus (ii) the number of shares of Stock underlying awards under the 2014 Equity Incentive Plan that on or after the Effective Date expire or become unexercisable, or are forfeited, cancelled or otherwise terminated, in each case, without delivery of shares or cash therefore, and would have become available again for grant under the Prior Plan in accordance with its terms (not to exceed 14,523,510 shares of Stock in the aggregate) (the “Share Pool”).
The following table summarizes the key assumptions used in the valuation model for valuing the Company's stock compensation awards under the 2021 Equity Incentive Plan:
| Dividend yield | ||||||||||||||
| Risk free interest rate | % | - | % | |||||||||||
| Expected volatility | % | - | % | |||||||||||
| Expected terms | ||||||||||||||
Stock Options
The fair value of stock options is determined at the grant date using the Black-Scholes option pricing model. The time-based stock option awards generally vest evenly over four years from the grant date and performance-based options vest based on specified targets such as Company performance and Company stock price hurdles.
A summary of the stock option activity under the 2021 Equity Inventive Plan for the year ended December 27, 2025 is presented below (share amounts in thousands):
| Number of Shares | Weighted Avg. Exercise Price per Share (in whole dollars) | Weighted Avg. Remaining Contractual Term | ||||||||||||||||||
Outstanding at December 28, 2024 | $ | |||||||||||||||||||
| Granted | ||||||||||||||||||||
| Exercised | ( | |||||||||||||||||||
| Forfeited or expired | ( | |||||||||||||||||||
Outstanding at December 27, 2025 | $ | |||||||||||||||||||
Exercisable at December 27, 2025 | $ | |||||||||||||||||||
In the fiscal year ended December 27, 2025, 13 options were exercised and in the fiscal year ended December 28, 2024, 48 options were exercised.
Stock option compensation expense of $1,539 , $1,701 and $1,124 was recognized in the accompanying Consolidated Statements of Comprehensive Income (Loss) for the years ended December 27, 2025, December 28, 2024 and December 30, 2023, respectively. As of December 27, 2025, there was $2,003 of unrecognized compensation expense for unvested common options. The expense will be recognized as a charge to earnings over a weighted average period of approximately 0.94 years.
The total intrinsic value of share options exercised during the years ended December 27, 2025 and December 28, 2024 was $10 and $46, respectively.
Restricted Stock Units
62| December 27, 2025 Form 10-K | ||||||||
The RSUs granted to employees for service generally vest (i) after three years for RSUs granted prior to 2025; and (ii) in equal annual installments over three years for RSUs granted in 2025 and thereafter, subject in each case to continued employment. The RSUs granted to non-employee directors generally vest in full on the first anniversary of the grant date or the date of the annual meeting following the grant date, whichever is earlier.
A summary of the restricted stock unit activity under the 2021 Equity Incentive Plan for the year ended December 27, 2025 is presented below (share amounts in thousands):
| Number of Shares | Weighted Avg. Grant Date Fair Value (in whole dollars) | |||||||||||||
Outstanding at December 28, 2024 | ||||||||||||||
| Granted | 9.30 | |||||||||||||
| Vested | ( | |||||||||||||
| Forfeited or expired | ( | |||||||||||||
Outstanding at December 27, 2025 | ||||||||||||||
Restricted stock unit compensation expense of $11,556 , $9,785 and $6,440 was recognized in the accompanying Consolidated Statements of Comprehensive Income (Loss) for the fiscal years ended December 27, 2025, December 28, 2024 and December 30, 2023, respectively. As of December 27, 2025, there was $17,227 of unrecognized compensation expense for unvested common stock options. The expense will be recognized as a charge to earnings over a weighted average period of approximately 1.07 years.
Performance Stock Units
Beginning in the first quarter of 2025, the Company determined to grant Performance Stock Units ("PSUs"), using return on invested capital as the performance metric, instead of granting stock options. The PSUs granted to employees for service generally vest after three years , subject to continued employment.
A summary of the performance stock unit activity under the 2021 Equity Inventive Plan for the year ended December 27, 2025 is presented below (share amounts in thousands):
| Number of Shares | Weighted Avg. Grant Date Fair Value (in whole dollars) | |||||||||||||
Outstanding at December 28, 2024 | ||||||||||||||
| Granted | 9.55 | |||||||||||||
| Vested | ||||||||||||||
| Forfeited or expired | ( | |||||||||||||
Outstanding at December 27, 2025 | ||||||||||||||
PSU compensation expense of $686 was recognized in the accompanying Consolidated Statements of Comprehensive Income (Loss) for the fiscal year ended December 27, 2025. As of December 27, 2025, there was $1,864 of unrecognized compensation expense for unvested PSUs. The expense will be recognized as a charge to earnings over a weighted average period of approximately 1.14 years.
2021 Employee Stock Purchase Plan
Our Employee Stock Purchase Plan ("ESPP") became effective on July 14, 2021, in which 1,140,754 shares of common stock were available for issuance under the ESPP. On June 3, 2025, the ESPP plan was amended to increase the share reserve by 1,000,000 shares of common stock, for a total of 2,140,754 shares available for issuance. Under the ESPP, eligible employees are granted options to purchase shares of common stock at 85% of the fair market value at the time of exercise. The option period commences on the first payroll date in January, April, July, and October of each year and ends approximately three months later on the last business day in March, June, September or December. No employee may be granted an option under the Plan if, immediately after the option is granted, the employee would own stock possessing five percent or more of the total combined voting power or value of all classes of stock of the Company.
Compensation expense associated with ESPP purchase rights is recognized on a straight-line basis over the vesting period. For the years ended December 27, 2025, December 28, 2024, and December 30, 2023, there was approximately $392 , $376 , and $355 of compensation expense related to the ESPP, respectively.
63| December 27, 2025 Form 10-K | ||||||||
12. EARNINGS PER SHARE
Basic earnings per share is computed based on the weighted-average number of shares of common stock outstanding during the period. Diluted earnings per share include the dilutive effect of stock options, restricted stock awards, and warrants. The following is a reconciliation of the basic and diluted Earnings Per Share ("EPS") computations for both the numerator and denominator (in thousands, except per share data):
| Year Ended December 27, 2025 | |||||||||||||||||
| Earnings (Numerator) | Shares (Denominator) | Per Share Amount | |||||||||||||||
| Net income | $ | $ | |||||||||||||||
| Dilutive effect of stock options and awards | — | — | |||||||||||||||
| Net income per diluted common share | $ | $ | |||||||||||||||
| Year Ended December 28, 2024 | |||||||||||||||||
| Earnings (Numerator) | Shares (Denominator) | Per Share Amount | |||||||||||||||
| Net income | $ | $ | |||||||||||||||
| Dilutive effect of stock options and awards | — | — | |||||||||||||||
| Net income per diluted common share | $ | $ | |||||||||||||||
| Year Ended December 30, 2023 | |||||||||||||||||
| Earnings (Numerator) | Shares (Denominator) | Per Share Amount | |||||||||||||||
| Net loss | $ | ( | $ | ( | |||||||||||||
| Dilutive effect of stock options and awards | — | — | |||||||||||||||
| Net loss per diluted common share | $ | ( | $ | ( | |||||||||||||
13. DERIVATIVES AND HEDGING
FASB ASC 815, Derivatives and Hedging ("ASC 815"), provides the disclosure requirements for derivatives and hedging activities with the intent to provide users of financial statements with an enhanced understanding of: (1) how and why an entity uses derivative instruments, (2) how the entity accounts for derivative instruments and related hedged items, and (3) how derivative instruments and related hedged items affect an entity's financial position, financial performance, and cash flows. Further, qualitative disclosures are required that explain the Company's objectives and strategies for using derivatives, as well as quantitative disclosures about the fair value of and gains and losses on derivative instruments.
The Company uses derivative financial instruments to manage its exposures to (1) interest rate fluctuations on its floating rate senior term loan and (2) fluctuations in foreign currency exchange rates. The Company measures those instruments at fair value and recognizes changes in the fair value of derivatives in earnings in the period of change, unless the derivative qualifies as an effective hedge that offsets certain exposures.
The Company does not enter into derivative transactions for speculative purposes and, therefore, holds no derivative instruments for trading purposes.
Interest Rate Swap Agreements
On December 19, 2023, the Company entered into an interest swap agreement ("2024 Swap 1") for a notional amount of $144,000 . The forward start date of the 2024 Swap 1 is July 21, 2024 and the termination date is January 31, 2027. The 2024 Swap 1 has a determined pay fixed interest rate of 3.8 %. In accordance with ASC 815, the Company determined the 2024 Swap 1 constituted an effective cash flow hedge and therefore changes in fair value are recorded within other comprehensive income (loss) within the Company's Statement of Comprehensive Income (Loss) and the deferred gains or losses are reclassified out of other comprehensive income (loss) into interest expense in the same period during which the hedged transactions affect earnings.
64| December 27, 2025 Form 10-K | ||||||||
On December 19, 2023, the Company entered into an interest swap agreement ("2024 Swap 2") for a notional amount of $216,000 . The forward start date of the 2024 Swap 2 was July 21, 2024 and the termination date is January 31, 2027. The 2024 Swap 2 has a determined pay fixed interest rate of 3.62 %. In accordance with ASC 815, the Company determined the 2024 Swap 2 constituted an effective cash flow hedge and therefore changes in fair value are recorded within other comprehensive income (loss) within the Company's Statement of Comprehensive Income (Loss) and the deferred gains or losses are reclassified out of other comprehensive income (loss) into interest expense in the same period during which the hedged transactions affect earnings.
The following table summarizes the Company's derivatives financial instruments:
| Asset Derivatives | Liability Derivatives | |||||||||||||||||||||||||||||||||||||
As of December 27, 2025 | As of December 28, 2024 | As of December 27, 2025 | As of December 28, 2024 | |||||||||||||||||||||||||||||||||||
| Balance Sheet Location | Fair Value | Fair Value | Balance Sheet Location | Fair Value | Fair Value | |||||||||||||||||||||||||||||||||
| Derivatives designated as hedging instruments: | ||||||||||||||||||||||||||||||||||||||
| 2024 Swap 1 | Other current/ non-current assets | Other non-current liabilities | ( | |||||||||||||||||||||||||||||||||||
| 2024 Swap 2 | Other current/ non-current assets | Other non-current liabilities | ( | |||||||||||||||||||||||||||||||||||
| Total hedging instruments | $ | $ | $ | ( | $ | |||||||||||||||||||||||||||||||||
During 2026, the Company estimates that an additional $1,083 will be reclassified as an increase to interest expense/income. Additional information with respect to the fair value of derivative instruments is included in Note 14 - Fair Value Measurements.
Foreign Currency Forward Contracts
During fiscal 2025 and 2024 the Company entered into foreign currency forward contracts. The purpose of the Company's foreign currency forward contracts is to manage the Company's exposure to fluctuations in the exchange rate of the Canadian dollar. As of December 30, 2023, the Company did not have any foreign currency forward contracts.
The total notional amount of contracts outstanding was C$1,551 and C$4,087 as of December 27, 2025 and December 28, 2024, respectively. The total fair value of the foreign currency forward contracts was $1,504 and $4,325 as of December 27, 2025 and December 28, 2024, respectively, and was reported on the accompanying Consolidated Balance Sheets in other current liabilities. An increase in other income of $94 and $269 was recorded in the Consolidated Statements of Comprehensive Income (Loss) for the change in fair value during year ended December 27, 2025 and December 28, 2024, respectively.
The Company's foreign currency forward contracts did not qualify for hedge accounting treatment because they did not meet the provisions specified in ASC 815. Accordingly, the gain or loss on these derivatives was recognized in other (income) expense in the Consolidated Statements of Comprehensive Income (Loss).
The Company does not enter into derivative transactions for speculative purposes and, therefore, holds no derivative instruments for trading purposes.
Additional information with respect to the fair value of derivative instruments is included in Note 14 - Fair Value Measurements.
14. FAIR VALUE MEASUREMENTS
The Company uses the accounting guidance that applies to all assets and liabilities that are being measured and reported on a fair value basis. The guidance defines fair value as the price that would be received to sell an asset or paid to transfer a liability in an orderly transaction between market participants at the measurement date. The guidance also establishes a fair value hierarchy that prioritizes the inputs to valuation techniques used to measure fair value. Assets and liabilities carried at fair value are classified and disclosed in one of the following three categories.
| Level 1: | Quoted market prices in active markets for identical assets or liabilities. | ||||
| Level 2: | Observable market-based inputs or unobservable inputs that are corroborated by market data. | ||||
65| December 27, 2025 Form 10-K | ||||||||
| Level 3: | Unobservable inputs reflecting the reporting entity's own assumptions. | ||||
The accounting guidance establishes a hierarchy which requires an entity to maximize the use of quoted market prices and minimize the use of unobservable inputs. An asset or liability's level is based on the lowest level of input that is significant to the fair value measurement.
The following tables set forth the Company's financial assets and liabilities that were measured at fair value on a recurring basis during the period, by level, within the fair value hierarchy:
As of December 27, 2025 | |||||||||||||||||||||||
| Level 1 | Level 2 | Level 3 | Total | ||||||||||||||||||||
| Trading securities | $ | $ | $ | $ | |||||||||||||||||||
| Interest rate swaps | ( | ( | |||||||||||||||||||||
| Foreign exchange forward contracts | |||||||||||||||||||||||
| Contingent consideration payable | |||||||||||||||||||||||
| As of December 28, 2024 | |||||||||||||||||||||||
| Level 1 | Level 2 | Level 3 | Total | ||||||||||||||||||||
| Trading securities | $ | $ | $ | $ | |||||||||||||||||||
| Interest rate swaps | |||||||||||||||||||||||
| Foreign exchange forward contracts | |||||||||||||||||||||||
| Contingent consideration payable | |||||||||||||||||||||||
Trading securities are valued using quoted prices on an active exchange. Trading securities represent assets held in a Rabbi Trust to fund deferred compensation liabilities and are included as restricted investments on the accompanying Consolidated Balance Sheets.
The Company utilizes interest rate swap contracts to manage our targeted mix of fixed and floating rate debt, and these contracts are valued using observable benchmark rates at commonly quoted intervals for the full term of the swap contracts. As of December 27, 2025 and December 28, 2024, the Company's interest rate swaps were recorded on the accompanying Consolidated Balance Sheets in accordance with ASC 815.
The Company utilizes foreign exchange forward contracts to manage our exposure to currency fluctuations in the Canadian dollar versus the U.S. dollar. The forward contracts were valued using observable benchmark rates at commonly quoted intervals during the term of the forward contract. As of December 27, 2025 and December 28, 2024, the foreign exchange forward contracts were included in other current liabilities on the accompanying Consolidated Balance Sheets.
The contingent consideration represents future potential earn-out payments related to the Resharp acquisition in fiscal 2019 in which the maximum payout for the contingent consideration is $25.0 million plus 1.8% of net knife-sharpening revenues for five years after the $25.0 million is fully paid and the Instafob acquisition in the first quarter of 2020 where payment is based on 5% of the net sales from 2020 through 2022 plus 1% of net sales from 2023 through 2029. The estimated fair value of the contingent earn-outs was determined using a Monte Carlo analysis examining the frequency and mean value of the resulting earn-out payments. The resulting value captures the risk associated with the form of the payout structure. The risk neutral method is applied, resulting in a value that captures the risk associated with the form of the payout structure and the projection risk. The carrying amount of the liability may fluctuate significantly and actual amounts paid may be materially different from the estimated value of the liability. The current and non-current portions of these obligations are reported separately on the Consolidated Balance Sheets as other accrued expense and other non-current liabilities, respectively. Subsequent changes in the fair value of the contingent consideration liabilities, as determined by using a simulation model of the Monte Carlo analysis that includes updated projections applicable to the liability, are recorded within other expense (income), net in the Consolidated Statements of Comprehensive Income (Loss).
The table below provides a summary of the changes in fair value of the Company’s contingent considerations (Level 3) for Resharp and Instafob as of December 27, 2025.
66| December 27, 2025 Form 10-K | ||||||||
Resharp | Instafob | ||||||||||||||||||||||||||||
Other accrued expense | Other non-current liabilities | Other accrued expense | Other non-current liabilities | Total | |||||||||||||||||||||||||
Fair value as of December 28, 2024 | $ | $ | $ | $ | $ | ||||||||||||||||||||||||
| Fair value of cash consideration paid | ( | ( | ( | ||||||||||||||||||||||||||
| Change in fair value of contingent consideration | ( | ( | ( | ||||||||||||||||||||||||||
Fair value as of December 27, 2025 | $ | $ | $ | $ | $ | ||||||||||||||||||||||||
Cash, restricted investments, accounts receivable, short-term borrowings and accounts payable are reflected in the Consolidated Financial Statements at book value, which approximates fair value, due to the short-term nature of these instruments. The carrying amount of the long-term debt under the revolving credit facility approximates the fair value at December 27, 2025 and December 28, 2024, as the interest rate is variable and approximates current market rates. The Company also believes the carrying amount of the long-term debt under the senior term loan approximates the fair value at December 27, 2025 and December 28, 2024 because, while subject to a minimum SOFR floor rate, the interest rate approximates current market rates of debt with similar terms and comparable credit risk.
Additional information with respect to the derivative instruments is included in Note 13 - Derivatives and Hedging.
15. COMMITMENTS AND CONTINGENCIES
Insurance Coverage
The Company self-insures our general liability including products liability, automotive liability, and workers' compensation losses up to $500 per occurrence. Catastrophic coverage has been purchased from third party insurers with a per occurrence and aggregate limit of $60,000 . The two risk areas involving the most significant accounting estimates are workers' compensation and automotive liability. Actuarial valuations performed by the Company's third-party risk insurance expert were used by the Company's management to form the basis for workers' compensation and automotive liability loss reserves. The actuary contemplated the Company's specific loss history, actual claims reported, and industry trends among statistical and other factors to estimate the range of reserves required. Risk insurance reserves are comprised of specific reserves for individual claims and additional amounts expected for development of these claims, as well as for incurred but not yet reported claims. The Company believes that the liability of approximately $2,184 recorded for such risk insurance reserves is adequate as of December 27, 2025.
As of December 27, 2025, the Company has provided certain vendors and insurers letters of credit aggregating $3,268 related to our product purchases and insurance coverage of product liability, workers' compensation, and general liability.
The Company self-insures our group health claims up to an annual stop loss limit of $300 per participant. Historical group insurance loss experience forms the basis for the recognition of group health insurance reserves. Provisions for losses expected under these programs are recorded based on an analysis of historical insurance claim data and certain actuarial assumptions. The Company believes that the liability of approximately $3,472 recorded for such group health insurance reserves is adequate as of December 27, 2025.
Import Duties
The Company imports large quantities of fastener products which are subject to customs requirements and to tariffs set by governments through mutual agreements and bilateral actions. The Company could be subject to the assessment of additional duties and interest if it or its suppliers fail to comply with customs regulations or similar laws. The U.S. Department of Commerce (the "Department”) conducts administrative reviews of compliance with anti-dumping duty and countervailing duty laws for certain nails products sourced from Asian countries. The Company sourced products under review from vendors in China and Taiwan during the periods selected for review. The Company accrues for the duty expense once it is determined to be probable and the amount can be reasonably estimated.
Litigation
67| December 27, 2025 Form 10-K | ||||||||
As of December 27, 2025, the Company is involved in litigation arising in the normal course of business. In management’s opinion, any such litigation is not expected to have a material adverse effect on the consolidated financial condition, results of operations, or cash flows.
The Kiosk Development Partner Dispute
On December 16, 2024, the Company entered into a settlement agreement with a kiosk development partner (the “Kiosk Partner”), pursuant to which the Company paid the Kiosk Partner a $5 million settlement payment on December 30, 2024 to resolve all claims and disputes alleged by the Kiosk Partner. The Kiosk Partner’s claims alleged that, among other things, the Company failed to pay certain per key royalty fees to the Kiosk Partner allegedly owed under a joint development agreement dating back over 10 years ago. Though the Company believes it had strong defenses to the claims made by the Kiosk Partner, the Company opted to settle the matter before litigation was filed in order to avoid the cost and uncertainty of protracted litigation.
16. STATEMENT OF CASH FLOWS
Supplemental disclosures of cash flows information are presented below:
| Year Ended December 27, 2025 | Year Ended December 28, 2024 | Year Ended December 30, 2023 | ||||||||||||||||||
| Cash paid during the period for: | ||||||||||||||||||||
| Interest | ||||||||||||||||||||
| Income taxes, net of refunds | ||||||||||||||||||||
As of December 27, 2025, December 28, 2024 and December 30, 2023, capital expenditures recorded in accounts payable totaled $886 , $1,627 , and $1,186 , respectively.
17. CONCENTRATION OF CREDIT RISKS
Financial instruments which potentially subject the Company to concentration of credit risk consist principally of cash and cash equivalents and trade receivables. The Company places its cash and cash equivalents with high credit quality financial institutions. The Company performs periodic credit evaluations of its customers' financial condition and generally does not require collateral.
For the year ended December 27, 2025, the largest two customers, Lowe's and Home Depot, accounted for 43.4 % of total revenues and 28.7 % of the year-end accounts receivable balance. For the year ended December 28, 2024, the largest two customers accounted for 40.9 % of total revenues and 32.6 % of the year end accounts receivable balance.
Certain customers operate using a purchasing cooperative(s) business model. In this model, independently owned hardware stores make purchases directly from the Company and are invoiced through a billing arrangement with a cooperative. Under this arrangement, the Company would invoice and receive payment from the cooperative for the product shipped directly to the store, and the cooperative would be responsible for invoicing and collecting from the independently owned hardware store. Due to the nature of the cooperative billing arrangement, the risk of collection of the receivables generated by sales to these independently owned hardware stores is concentrated with the cooperative. The Company does not believe a sales concentration exists in these scenarios, as the independently owned hardware stores can continue to make purchases from the Company via a direct bill arrangement or via another purchasing cooperative. As of December 27, 2025 and December 28, 2024, approximately 17.1 % and 15 % of the Company's accounts receivable was derived through the Ace Hardware purchasing cooperative, respectively.
Except as described in the paragraphs above, no other customer accounted for more than 10% of the Company's accounts receivables in 2025 or 2024.
In the years ended December 27, 2025, December 28, 2024 and December 30, 2023, the Company derived over 10% of its total revenues from two separate customers which operated in each of the operating segments. The following table presents revenue from each customer as a percentage of total revenue for each of the years ended:
68| December 27, 2025 Form 10-K | ||||||||
| Year Ended December 27, 2025 | Year Ended December 28, 2024 | Year Ended December 30, 2023 | |||||||||||||||
| Lowe's | % | % | % | ||||||||||||||
| Home Depot | % | % | % | ||||||||||||||
18. SEGMENT REPORTING AND GEOGRAPHIC INFORMATION
The Company's segment reporting structure uses the Company's management reporting structure as the foundation for how the Company manages its business. The Company's reportable segments are strategic business units that offer different products and services, and in the case of our Canada segment in a different geography. They are managed separately due to different products and marketing strategies. The Company periodically evaluates its segment reporting structure in accordance with ASC 350-20-55 and has concluded that it has three reportable segments as of December 27, 2025.
The segments are as follows:
•Hardware and Protective Solutions
•Robotics and Digital Solutions
•Canada
In the second quarter of 2025, the Company realigned its Hardware and Protective Solutions segment to include the sales of accessories, which are now managed by the Hardware and Protective Solutions leadership team. Previously, accessories were included under the Robotics and Digital Solutions segment leadership team. Please see Note 1 - Basis of Presentation for more information.
The Hardware and Protective Solutions segment distributes fasteners and related hardware items, threaded rod, personal protective equipment, key accessories, and letters, numbers, and signs to hardware stores, home centers, mass merchants, and other retail outlets primarily in the United States and Mexico.
The Robotics and Digital Solutions segment consists of key duplication and engraving kiosks that can be operated directly by the consumer, primarily in the United States. The kiosks operate in retail and other high-traffic locations offering customized licensed and unlicensed products targeted to consumers in the respective locations. It also includes our associate-assisted key duplication systems. The Robotics and Digital Solutions segment also includes Resharp, our robotic knife sharpening business, and Instafob, which specializes in RFID ("Radio Frequency Identification") fob duplication technology.
The Canada segment distributes fasteners and related hardware items, threaded rod, keys, key duplicating systems, engraving kiosks, accessories, personal protective equipment, and identification items, such as tags and letters, numbers, and signs to hardware stores, home centers, mass merchants, industrial distributors, automotive aftermarket distributors, and other retail outlets and industrial Original Equipment Manufacturers (“OEMs”) in Canada. The Canada segment also produces fasteners, stampings, fittings, and processes threaded parts for automotive suppliers and industrial OEMs.
For a reconciliation of our segment sales by product category and geographic area, please see Note 2 - Summary of Significant Accounting Policies. For details on our major customers please see Note 17 - Concentration of Credit Risks.
The Company has transitioned from using segment operating income in prior years as a measure of performance and now utilizes segment adjusted EBITDA. The Company measures the performance of its segments using segment adjusted earnings before interest, taxes, depreciation and amortization (“segment adjusted EBITDA”).
The Company’s President and Chief Executive Officer, who is the Chief Operating Decision Maker (“CODM”), uses segment adjusted EBITDA predominantly in the annual budget and forecasting process. The CODM considers budget-to-actual variances, expressed as both actual amounts and as a percentage of sales, on a monthly, quarter to date, and year to date basis when making decisions about allocating resources to the segments. The CODM also uses segment adjusted EBITDA in competitive analysis by benchmarking the Company’s competitors. The competitive analysis along with the monitoring of budgeted versus actual results are used in assessing performance of the segment and in establishing management’s compensation. The CODM reviews balance sheet accounts on a consolidated basis and does not regularly review balance sheet accounts by segment as part of their performance assessment and decision-making process. The CODM primarily focuses on net sales growth,
69| December 27, 2025 Form 10-K | ||||||||
cost efficiencies, market expansion and product development rather than financial position. The accounting policies of the Company’s segments are the same as those described in Note 1 - Basis of Presentation.
Segment adjusted EBITDA is not defined under GAAP and may not be comparable to similarly titled measures used by other companies and should not be considered a substitute for net earnings or other results reported in accordance with GAAP.
The tables below present net sales, significant segment expenses, and segment adjusted EBITDA for the reportable segments for the years ended December 27, 2025, December 28, 2024, and December 30, 2023. See Note 2 - Summary of Significant Accounting Policies for a reconciliation of total reportable segments' revenues to consolidated revenues. Certain amounts in the prior year Consolidated Financial Statements and in the Notes to the Consolidated Financial Statements were reclassified to conform to the current year’s presentation. This had no impact on the prior period's consolidated balance sheets, consolidated statements of comprehensive income (loss), consolidated statements of cash flows, or consolidated statements of stockholders' equity.
| Hardware and Protective Solutions | Year Ended December 27, 2025 | Year Ended December 28, 2024 | Year Ended December 30, 2023 | |||||||||||||||||
| Net Sales | $ | $ | $ | |||||||||||||||||
| Significant segment expenses | ||||||||||||||||||||
Adjusted cost of sales (exclusive of depreciation and amortization)(1) | ||||||||||||||||||||
Adjusted selling expense(2) | ||||||||||||||||||||
Adjusted Warehouse expense (3) | ||||||||||||||||||||
Adjusted General and administrative expense(4) | ||||||||||||||||||||
Other segment items(5) | ( | ( | ( | |||||||||||||||||
| Segment Adjusted EBITDA | $ | $ | $ | |||||||||||||||||
(1)Adjusted cost of sales (exclusive of depreciation and amortization) excludes an inventory revaluation charge made in the fourth quarter of 2023.
(2)Adjusted selling expense excludes expense related to corporate restructuring activities.
(3)Adjusted warehouse excludes restructuring expense associated with our distribution center relocations and corporate restructuring activities.
(4)Adjusted general and administrative expense excludes stock-based compensation, acquisition and integration costs, expense associated with corporate restructuring and amounts related to the Cybersecurity Incident.
(5)Other excludes an impairment charge related to the write down of intangible assets, primarily related to review of certain product offerings in 2023.
Robotics and Digital Solutions | Year Ended December 27, 2025 | Year Ended December 28, 2024 | Year Ended December 30, 2023 | |||||||||||||||||
| Net sales | $ | $ | $ | |||||||||||||||||
| Significant segment expenses | ||||||||||||||||||||
| Cost of sales (exclusive of depreciation and amortization) | ||||||||||||||||||||
Adjusted selling expense(1) | ||||||||||||||||||||
Adjusted Warehouse expense (2) | ||||||||||||||||||||
Adjusted General and administrative expense(3) | ||||||||||||||||||||
Other segment items(4) | ||||||||||||||||||||
| Segment Adjusted EBITDA | $ | $ | $ | |||||||||||||||||
(1)Adjusted selling expense excludes related to corporate restructuring activities.
(2)Adjusted warehouse expense excludes restructuring expense associated with our distribution center relocations and corporate restructuring activities.
(3)Adjusted general and administrative expense excludes stock compensation expense, acquisition and integration expense, consulting expense and legal charges related to settlements, see Note 15 - Commitments and Contingencies.
70| December 27, 2025 Form 10-K | ||||||||
(4)Other excludes the gain or loss on the revaluation of our contingent consideration liability, see Note 14 - Fair Value Measurements.
Canada | Year Ended December 27, 2025 | Year Ended December 28, 2024 | Year Ended December 30, 2023 | |||||||||||||||||
| Net sales | $ | $ | $ | |||||||||||||||||
| Significant segment expenses | ||||||||||||||||||||
| Cost of sales (exclusive of depreciation and amortization) | ||||||||||||||||||||
Adjusted selling expense(1) | ||||||||||||||||||||
Adjusted Warehouse expense (2) | ||||||||||||||||||||
Adjusted General and administrative expense(3) | ||||||||||||||||||||
| Other segment items | ( | |||||||||||||||||||
| Segment Adjusted EBITDA | $ | $ | $ | |||||||||||||||||
(1)Adjusted selling expense excludes restructuring expense.
(2)Adjusted warehouse expense excludes restructuring expense associated with our distribution center relocations and corporate restructuring activities.
(3)Adjusted general and administrative expense excludes stock based compensation and expense associated with corporate restructuring activities.
The following table reconciles segment adjusted EBITDA by segment to the Company’s consolidated income (loss) before income taxes. Certain amounts in the prior year presentation between segments were reclassified to conform to the current year’s presentation.
Year Ended December 27, 2025 | Year Ended December 28, 2024 | Year Ended December 30, 2023 | ||||||||||||||||||
| Hardware and Protective Solutions | $ | $ | $ | |||||||||||||||||
| Robotics and Digital Solutions | ||||||||||||||||||||
| Canada | ||||||||||||||||||||
| Total adjusted EBITDA | ||||||||||||||||||||
| Interest expense | ||||||||||||||||||||
| Depreciation | ||||||||||||||||||||
| Amortization | ||||||||||||||||||||
| Stock compensation expense | ||||||||||||||||||||
| Restructuring and other costs | ||||||||||||||||||||
| Litigation expense | ||||||||||||||||||||
| Transaction and integration expense | ||||||||||||||||||||
| Change in fair value of contingent consideration | ( | ( | ||||||||||||||||||
| Impairment charges | ||||||||||||||||||||
| Refinancing costs | ||||||||||||||||||||
| Total adjusting items | ||||||||||||||||||||
| Income (loss) before income taxes | $ | $ | $ | ( | ||||||||||||||||
71| December 27, 2025 Form 10-K | ||||||||
Financial Statement Schedule:
Schedule II - VALUATION ACCOUNTS
(dollars in thousands)
| Deducted From Assets in Balance Sheet | |||||
| Allowance for Doubtful Accounts | |||||
| Ending Balance - December 31, 2022 | $ | ||||
| Additions charged to cost and expense | |||||
| Deductions due to: | |||||
| Others | ( | ||||
| Ending Balance - December 30, 2023 | |||||
| Additions charged to cost and expense | |||||
| Deductions due to: | |||||
| Others | ( | ||||
| Ending Balance - December 28, 2024 | |||||
| Additions charged to cost and expense | |||||
| Deductions due to: | |||||
| Others | ( | ||||
| Ending Balance - December 27, 2025 | $ | ||||
72| December 27, 2025 Form 10-K | ||||||||
| ITEM 9 – CHANGES IN AND DISAGREEMENTS WITH ACCOUNTANTS ON ACCOUNTING AND FINANCIAL DISCLOSURE. | ||
None.
.
ITEM 9A – CONTROLS AND PROCEDURES. | ||
Disclosure Controls and Procedures
Disclosure controls and procedures, as defined in Rules 13a-15(e) and 15d-15(e) under the Securities Exchange Act of 1934, as amended (the “Exchange Act”), are those controls and procedures that are designed to ensure that material information relating to Hillman Solutions Corp. required to be disclosed by the Company in reports that we file or submit under the Exchange Act is recorded, processed, summarized, and reported within the time periods specified in the SEC's rules and forms and that such information is accumulated and communicated to the Company's management, including the chief executive officer and the chief financial officer, as appropriate, to allow timely decisions regarding required disclosure. The Company carried out an evaluation, under the supervision and with the participation of the Company's management, including the chief executive officer and the chief financial officer, of the effectiveness of the design and operation of the disclosure controls and procedures. Based upon that evaluation, the Company's Chief Executive Officer and Chief Financial Officer concluded that our disclosure controls and procedures were effective as of December 27, 2025 to provide reasonable assurance that information required to be disclosed in our reports that we file or submit under the Exchange Act is recorded, processed, summarized and reported within the time periods specified in the SEC rules and forms and that such information is accumulated and communicated to our management, including our Chief Executive Officer and Chief Financial Officer, as appropriate, to allow timely decisions regarding required disclosure. We view our internal control over financial reporting as an integral part of our disclosure controls and procedures.
Management has concluded that the company’s consolidated financial statements in this Form 10-K fairly present, in all material respects, our financial position, results of operations and cash flows as of the dates, and for the periods presented, in conformity with U.S. GAAP.
Management's Annual Report on Internal Control Over Financial Reporting
Our management is responsible for establishing and maintaining adequate internal control over financial reporting as such term is defined in Rule 13a-15(f) under the Exchange Act. Pursuant to the rules and regulations of the Commission, internal control over financial reporting is a process designed by, or under the supervision of, the Company's principal executive and principal financial officers, or persons performing similar functions, and effected by the Company's Board of Directors, management, and other personnel, to provide reasonable assurance regarding the reliability of financial reporting and the preparation of financial statements for external purposes in accordance with generally accepted accounting principles and includes those policies and procedures that:
•Pertain to the maintenance of records that in reasonable detail accurately and fairly reflect the transactions and the dispositions of assets;
•Provide reasonable assurance that transactions are recorded as necessary to permit preparation of financial statements in accordance with generally accepted accounting principles, and that receipts and expenditures of the Company are being made only in accordance with appropriate authorizations; and
•Provide reasonable assurance regarding prevention or timely detection of unauthorized acquisition, use, or disposition of the Company's assets that could have a material effect on our financial statements.
Because of its inherent limitations, internal control over financial reporting may not prevent or detect misstatements. Therefore, even those systems determined to be effective can provide only reasonable assurance with respect to financial statement preparation and presentation.
73| December 27, 2025 Form 10-K | ||||||||
The Company's management has evaluated the effectiveness of the Company's internal control over financial reporting as of December 27, 2025, using the criteria set forth by the Committee of Sponsoring Organizations of the Treadway Commission (COSO) in Internal Control - Integrated Framework (2013 framework). Based on such evaluation, management concluded that internal control over financial reporting was effective as of December 27, 2025. Management's report on internal control over financial reporting is set forth above under the heading, “Report of Management on Internal Control Over Financial Reporting” in Item 8 of this annual report on Form 10-K.
74| December 27, 2025 Form 10-K | ||||||||
Attestation Report of Independent Registered Public Accounting Firm on Internal Control Over Financial Reporting
REPORT OF INDEPENDENT REGISTERED PUBLIC ACCOUNTING FIRM
To the Shareholders and the Board of Directors of Hillman Solutions Corp.
Opinion on Internal Control over Financial Reporting
We have audited the internal control over financial reporting of Hillman Solutions Corp. and subsidiaries (the "Company") as of December 27, 2025, based on criteria established in Internal Control — Integrated Framework (2013) issued by the Committee of Sponsoring Organizations of the Treadway Commission (COSO). In our opinion, the Company maintained, in all material respects, effective internal control over financial reporting as of December 27, 2025, based on criteria established in Internal Control — Integrated Framework (2013) issued by COSO.
We have also audited, in accordance with the standards of the Public Company Accounting Oversight Board (United States) (PCAOB), the consolidated financial statements as of and for the year ended December 27, 2025, of the Company and our report dated February 17, 2026, expressed an unqualified opinion on those financial statements.
Basis for Opinion
The Company's management is responsible for maintaining effective internal control over financial reporting and for its assessment of the effectiveness of internal control over financial reporting, included in the accompanying Report of Management on Internal Control Over Financial Reporting. Our responsibility is to express an opinion on the Company's internal control over financial reporting based on our audit. We are a public accounting firm registered with the PCAOB and are required to be independent with respect to the Company in accordance with the U.S. federal securities laws and the applicable rules and regulations of the Securities and Exchange Commission and the PCAOB.
We conducted our audit in accordance with the standards of the PCAOB. Those standards require that we plan and perform the audit to obtain reasonable assurance about whether effective internal control over financial reporting was maintained in all material respects. Our audit included obtaining an understanding of internal control over financial reporting, assessing the risk that a material weakness exists, testing and evaluating the design and operating effectiveness of internal control based on the assessed risk, and performing such other procedures as we considered necessary in the circumstances. We believe that our audit provides a reasonable basis for our opinion.
Definition and Limitations of Internal Control over Financial Reporting
A company's internal control over financial reporting is a process designed to provide reasonable assurance regarding the reliability of financial reporting and the preparation of financial statements for external purposes in accordance with generally accepted accounting principles. A company's internal control over financial reporting includes those policies and procedures that (1) pertain to the maintenance of records that, in reasonable detail, accurately and fairly reflect the transactions and dispositions of the assets of the company; (2) provide reasonable assurance that transactions are recorded as necessary to permit preparation of financial statements in accordance with generally accepted accounting principles, and that receipts and expenditures of the company are being made only in accordance with authorizations of management and directors of the company; and (3) provide reasonable assurance regarding prevention or timely detection of unauthorized acquisition, use, or disposition of the company's assets that could have a material effect on the financial statements.
Because of its inherent limitations, internal control over financial reporting may not prevent or detect misstatements. Also, projections of any evaluation of effectiveness to future periods are subject to the risk that controls may become inadequate because of changes in conditions, or that the degree of compliance with the policies or procedures may deteriorate.
/s/ DELOITTE & TOUCHE LLP
Cincinnati, Ohio
February 17, 2026
75| December 27, 2025 Form 10-K | ||||||||
Changes in Internal Control over Financial Reporting
There were no changes in the Company's internal control over financial reporting as defined in Rule 13a-15(f) of the Exchange Act of 1934, as amended, that occurred during the quarter ended December 27, 2025, that have materially affected, or are reasonably likely to materially affect, the Company's internal control over financial reporting except as otherwise described above in this Item 9A.
| ITEM 9B – OTHER INFORMATION. | ||
Insider Adoption or Termination of Trading Arrangements
On November 6, 2025, Amanda Kitzberger, Chief Legal Officer & Secretary of the Company, adopted a trading arrangement for the sale of securities of the Company’s common stock (a “Rule 10b5-1 Trading Plan” )
| ITEM 9C: DISCLOSURE REGARDING FOREIGN JURISDICTIONS THAT PREVENT INSPECTIONS. | ||
Not applicable.
| PART III | ||||||||||||||
ITEM 10 – DIRECTORS, EXECUTIVE OFFICERS, AND CORPORATE GOVERNANCE. | ||
Information required by this item is set forth under the captions Election of Directors, Information About Our Executive Officers, Delinquent Section 16(a) Reports, Code of Conduct and Ethics, and Committees of the Board of Directors in our Proxy Statement for the 2026 Annual Meeting of Stockholders (the “2026 Proxy Statement”). That information is incorporated herein by reference.
We have adopted a code of ethics that applies to all of our employees, including our Chief Executive Officer, Chief Financial Officer, Chief Accounting Officer, and other finance organization employees. The code of ethics is publicly available on our website at www.hillmangroup.com. If we make any substantive amendments to the code of ethics or grant any waiver, including any implicit waiver, from a provision of the code to our Chief Executive Officer, Chief Financial Officer, or Chief Accounting Officer, we will disclose the nature of the amendment or waiver on that website or in a report on Form 8-K.
Insider Trading Arrangements and Policies
We are committed to promoting high standards of ethical business conduct and compliance with applicable laws, rules and regulations. As part of this commitment, we have adopted our Insider Trading Policy governing the purchase, sale, and/or other dispositions of our securities by our directors, officers, employees and certain
76| December 27, 2025 Form 10-K | ||||||||
contractors, that we believe is reasonably designed to promote compliance with insider trading laws, rules and regulations, and the exchange listing standards applicable to us. A copy of our Insider Trading Policy is filed as Exhibit 19.1 to this Annual Report on Form 10-K.
ITEM 11 – EXECUTIVE COMPENSATION. | ||
Information required by this item is set forth under the captions Executive Compensation, Compensation Discussion and Analysis, Compensation Committee Report, Compensation Tables, and Director Compensation in the 2026 Proxy Statement and is hereby incorporated by reference into this Form 10-K.
| ITEM 12 – SECURITY OWNERSHIP OF CERTAIN BENEFICIAL OWNERS AND MANAGEMENT AND RELATED STOCKHOLDER MATTERS. | ||
The information required by this Item is set forth in the section entitled "Beneficial Ownership of Common Stock" and "Equity Compensation Plan Information" in the 2026 Proxy Statement and is hereby incorporated by reference into this Form 10-K.
| ITEM 13 – CERTAIN RELATIONSHIPS AND RELATED TRANSACTIONS. | ||
The information required by this Item is set forth in the sections entitled Certain Relationships and Related Party Transactions in the 2026 Proxy Statement and is hereby incorporated by reference into this Form 10-K.
| ITEM 14 – PRINCIPAL ACCOUNTING FEES AND SERVICES. | ||
Our independent registered public accounting firm is Deloitte & Touche LLP , Cincinnati, OH , Auditor Firm ID: 34 .
The information required by this Item is set forth in the section entitled Ratification of the Appointment of Independent Auditor in the 2026 Proxy Statement and is hereby incorporated by reference into this Form 10-K.
| PART IV | ||||||||||||||
| ITEM 15 – EXHIBITS, FINANCIAL STATEMENT SCHEDULES. | ||
(a) Documents Filed as a Part of the Report:
77| December 27, 2025 Form 10-K | ||||||||
1.Financial Statements: See “Index to Financial Statements” in “Item 8. Financial Statements and Supplementary Data” herein.
2.Financial Statement Schedules: All schedules are omitted for the reason that the information is included in the financial statements or the notes thereto or that they are not required or are not applicable.
3.Exhibits: The exhibits listed in the accompanying index to exhibits are filed or incorporated by reference as part of this Annual Report on Form 10-K.
| 3.1 | |||||||||||
| 3.2 | |||||||||||
| 4.1 | |||||||||||
| 10.1 | |||||||||||
10.2* | |||||||||||
| 10.3* | |||||||||||
10.4* | |||||||||||
10.5* | |||||||||||
10.6* | |||||||||||
10.7* | |||||||||||
10.8* | |||||||||||
10.9* | |||||||||||
10.10* | |||||||||||
10.11* | |||||||||||
10.12* | |||||||||||
10.13* | |||||||||||
10.14* | |||||||||||
10.15* | |||||||||||
10.16+ | |||||||||||
78| December 27, 2025 Form 10-K | ||||||||
79| December 27, 2025 Form 10-K | ||||||||
10.34* | |||||||||||
| 19.1 | |||||||||||
| 21.1 | |||||||||||
| 23.1 | |||||||||||
| 31.1 | |||||||||||
| 31.2 | |||||||||||
| 32.1 | |||||||||||
| 32.2 | |||||||||||
| 97 | |||||||||||
| 101 | The following financial information from the Company’s Annual Report on Form 10-K for the year ended December 27, 2025, formatted in inline eXtensible Business Reporting Language (iXBRL): (i) Consolidated Balance Sheets, (ii) Consolidated Statements of Comprehensive Income (Loss), (iii) Consolidated Statements of Cash Flows, (iv) Consolidated Statements of Stockholders’ Equity, and (v) the Notes to Consolidated Financial Statements (filed herewith). | ||||||||||
| 104 | Cover Page Interactive Data File (formatted as Inline XBRL and contained in Exhibit 101) (filed herewith). | ||||||||||
* Indicates management contract or any compensatory plan, contract or arrangement.
+ Certain of the exhibits and schedules to this Exhibit have been omitted in accordance with Regulation S-K Item 601(a)(5). The Company agrees to furnish a copy of all omitted exhibits and schedules to the SEC upon its request.
80| December 27, 2025 Form 10-K | ||||||||
| ITEM 16 – FORM 10-K SUMMARY. | ||
None
SIGNATURES
Pursuant to the requirements of Section 13 or 15(d) of the Securities Exchange Act of 1934, the registrant has duly caused this report to be signed on its behalf by the undersigned, thereunto duly authorized.
| HILLMAN SOLUTIONS CORP. | ||||||||||||||
| Dated: | February 17, 2026 | By: | /s/ Robert O. Kraft | |||||||||||
| Robert O. Kraft | ||||||||||||||
| Title: | Chief Financial Officer and Duly Authorized Officer of the Registrant | |||||||||||||
Pursuant to the requirements of the Securities Exchange Act of 1934, this report has been signed below by the following persons on behalf of the Registrant and in the capacities and on the dates indicated below.
| Signature | Capacity | Date | |||||||||
/s/ Jon Michael Adinolfi | Principal Executive Officer, President, and Director | February 17, 2026 | |||||||||
| Jon Michael Adinolfi | |||||||||||
| /s/ Robert O. Kraft | Principal Financial Officer | February 17, 2026 | |||||||||
| Robert O. Kraft | |||||||||||
| /s/ Anne S. McCalla | Principal Accounting Officer | February 17, 2026 | |||||||||
| Anne S. McCalla | |||||||||||
| /s/ Douglas J. Cahill | Chairman and Director | February 17, 2026 | |||||||||
| Douglas J. Cahill | |||||||||||
| /s/ Diana Dowling | Director | February 17, 2026 | |||||||||
| Diana Dowling | |||||||||||
| /s/ Teresa S. Gendron | Director | February 17, 2026 | |||||||||
| Teresa S. Gendron | |||||||||||
| /s/ Diane C. Honda | Director | February 17, 2026 | |||||||||
Diane C. Honda | |||||||||||
| /s/ Aaron P. Jagdfeld | Director | February 17, 2026 | |||||||||
| Aaron P. Jagdfeld | |||||||||||
| /s/ Daniel O'Leary | Director | February 17, 2026 | |||||||||
| Daniel O'Leary | |||||||||||
| /s/ David A. Owens | Director | February 17, 2026 | |||||||||
| David A. Owens | |||||||||||
| /s/ John Swygert | Director | February 17, 2026 | |||||||||
| John Swygert | |||||||||||
| /s/ Philip K. Woodlief | Director | February 17, 2026 | |||||||||
| Philip K. Woodlief | |||||||||||
81| December 27, 2025 Form 10-K | ||||||||