EX-99.2
Published on February 23, 2023
Quarterly Earnings Presentation Q4 2022 February 23, 2023
2Earnings Presentation Q4 2022 PresBuilder Placeholder - Delete this box if you see it on a slide, but DO NOT REMOVE this box from the slide layout This presentation contains certain forward-looking statements, including, but not limited to, certain plans, expectations, goals, projections, and statements, which are not historical facts and are subject to numerous assumptions, risks, and uncertainties. Statements that do not describe historical or current facts, including statements about beliefs and expectations, are forward-looking statements. All forward-looking statements are made in good faith by the company and are intended to qualify for the safe harbor from liability established by Section 27A of the Securities Act of 1933, Section 21E of the Securities Exchange Act of 1934, and the Private Securities Litigation Reform Act of 1995.You should not rely on these forward- looking statements as predictions of future events. Words such as "expect," "estimate," "project," "budget," "forecast," "anticipate," "intend," "plan," “target”, “goal”, "may," "will," "could," "should," "believes," "predicts," "potential," "continue," and similar expressions are intended to identify such forward-looking statements. These forward-looking statements include, without limitation, the Company’s expectations with respect to future performance. These forward-looking statements involve significant risks and uncertainties that could cause the actual results to differ materially from the expected results. Most of these factors are outside the Company's control and are difficult to predict. Factors that may cause such differences include, but are not limited to: (1) unfavorable economic conditions that may affect operations, financial condition and cash flows including spending on home renovation or construction projects, inflation, recessions, instability in the financial markets or credit markets; (2) increased supply chain costs, including raw materials, sourcing, transportation and energy; (3) the highly competitive nature of the markets that we serve (4) ability to continue to innovate with new products and services; (5) seasonality; (6) large customer concentration; (7) ability to recruit and retain qualified employees; (8) the outcome of any legal proceedings that may be instituted against the Company; (9) adverse changes in currency exchange rates; (10) the impact of COVID-19 on the Company’s business; or (11) regulatory changes and potential legislation that could adversely impact financial results. The foregoing list of factors is not exclusive, and readers should also refer to those risks that are included in the Company’s filings with the Securities and Exchange Commission (“SEC”), including its Annual Report on Form 10-K for the fiscal year ended December 31, 2022 to be filed subsequent to the conference call presenting 2022 results. Given these uncertainties, current or prospective investors are cautioned not to place undue reliance on any such forward looking statements. Except as required by applicable law, the Company does not undertake or accept any obligation or undertaking to release publicly any updates or revisions to any forward-looking statements in this communication to reflect any change in its expectations or any change in events, conditions or circumstances on which any such statement is based. Presentation of Non-GAAP Financial Measures In addition to the results provided in accordance with U.S. generally accepted accounting principles (“GAAP”) throughout this presentation the company has provided non-GAAP financial measures, which present results on a basis adjusted for certain items. The company uses these non-GAAP financial measures for business planning purposes and in measuring its performance relative to that of its competitors. The company believes that these non- GAAP financial measures are useful financial metrics to assess its operating performance from period-to-period by excluding certain items that the company believes are not representative of its core business. These non-GAAP financial measures are not intended to replace, and should not be considered superior to, the presentation of the company’s financial results in accordance with GAAP. The use of the non-GAAP financial measures terms may differ from similar measures reported by other companies and may not be comparable to other similarly titled measures. These non-GAAP financial measures are reconciled from the respective measures under GAAP in the appendix below. The company is not able to provide a reconciliation of the company’s non-GAAP financial guidance to the corresponding GAAP measures without unreasonable effort because of the inherent difficulty in forecasting and quantifying certain amounts necessary for such a reconciliation such as certain non-cash, nonrecurring or other items that are included in net income and EBITDA as well as the related tax impacts of these items and asset dispositions / acquisitions and changes in foreign currency exchange rates that are included in cash flow, due to the uncertainty and variability of the nature and amount of these future charges and costs. Forward Looking Statements
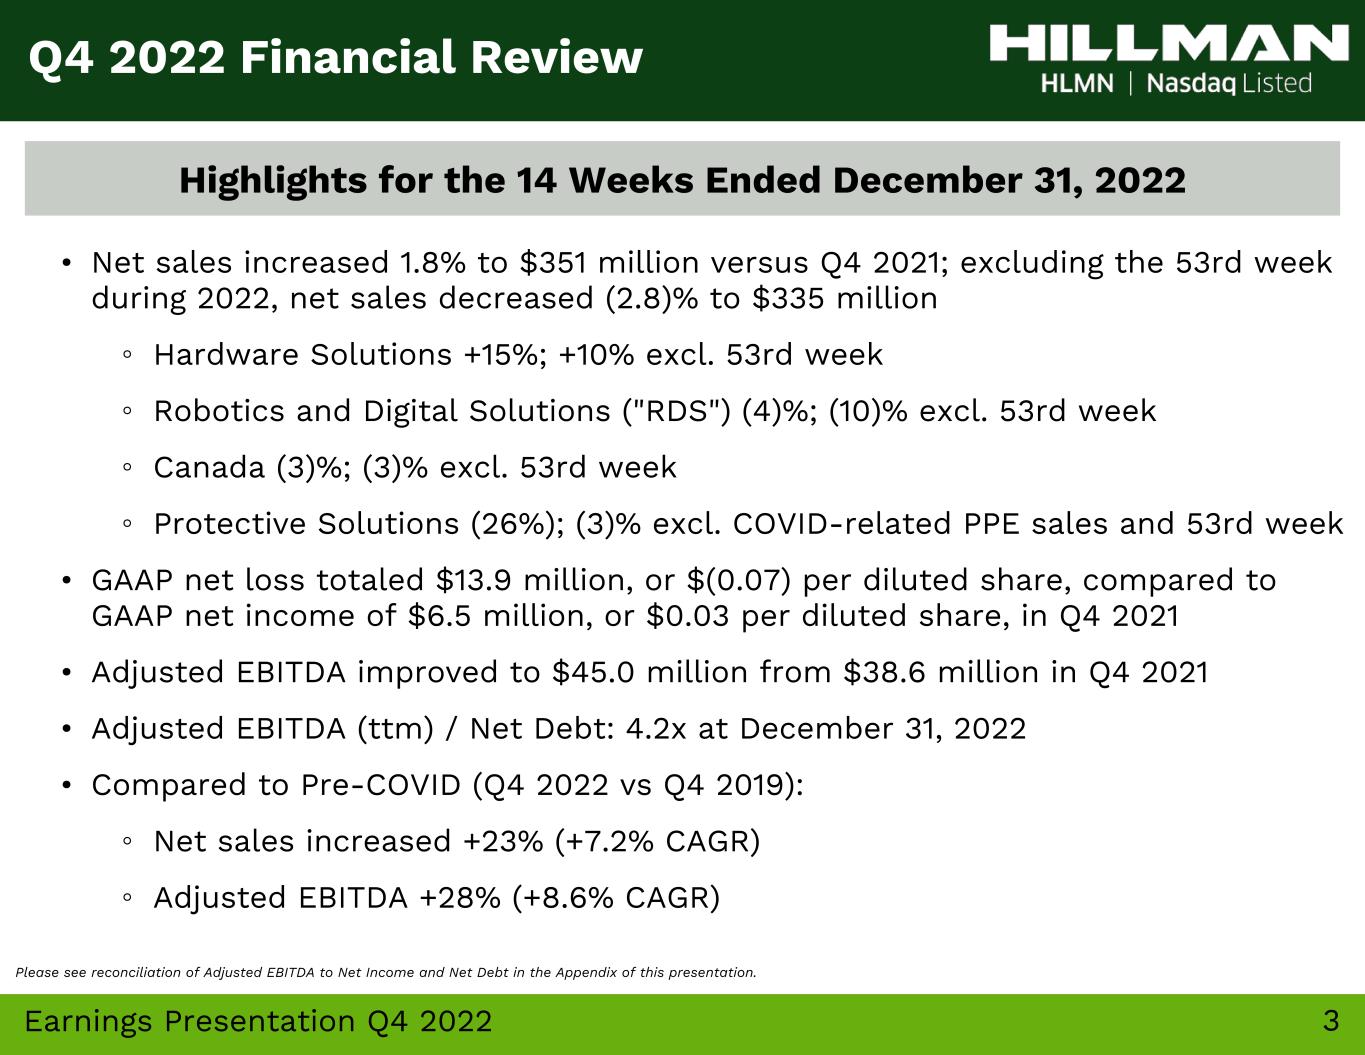
3Earnings Presentation Q4 2022 • Net sales increased 1.8% to $351 million versus Q4 2021; excluding the 53rd week during 2022, net sales decreased (2.8)% to $335 million ◦ Hardware Solutions +15%; +10% excl. 53rd week ◦ Robotics and Digital Solutions ("RDS") (4)%; (10)% excl. 53rd week ◦ Canada (3)%; (3)% excl. 53rd week ◦ Protective Solutions (26%); (3)% excl. COVID-related PPE sales and 53rd week • GAAP net loss totaled $13.9 million, or $(0.07) per diluted share, compared to GAAP net income of $6.5 million, or $0.03 per diluted share, in Q4 2021 • Adjusted EBITDA improved to $45.0 million from $38.6 million in Q4 2021 • Adjusted EBITDA (ttm) / Net Debt: 4.2x at December 31, 2022 • Compared to Pre-COVID (Q4 2022 vs Q4 2019): ◦ Net sales increased +23% (+7.2% CAGR) ◦ Adjusted EBITDA +28% (+8.6% CAGR) Q4 2022 Financial Review Please see reconciliation of Adjusted EBITDA to Net Income and Net Debt in the Appendix of this presentation. Highlights for the 14 Weeks Ended December 31, 2022
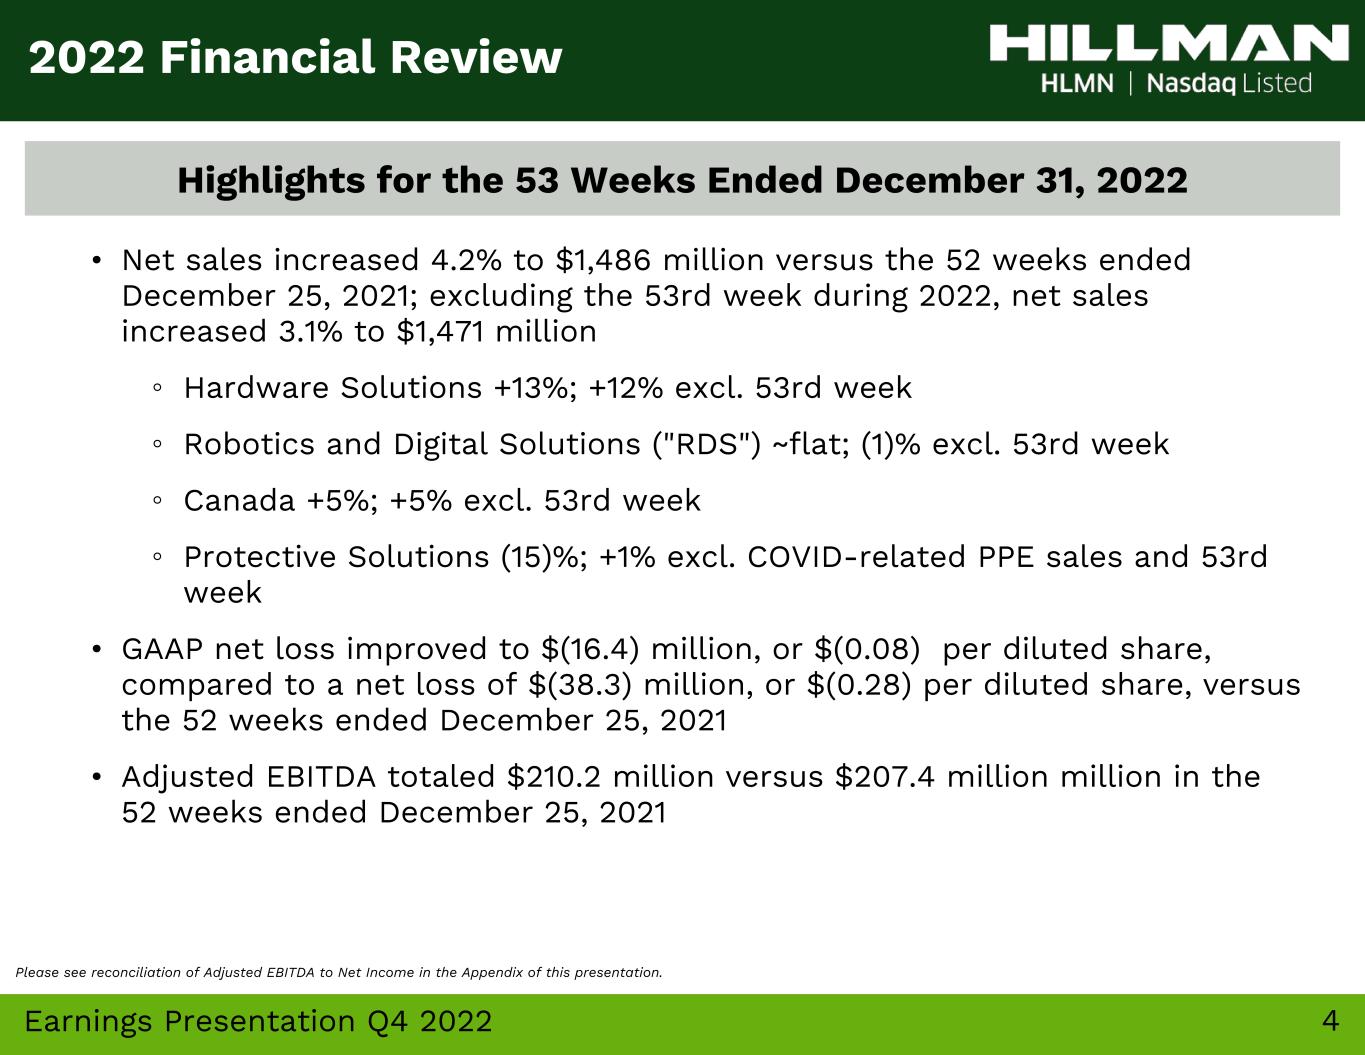
4Earnings Presentation Q4 2022 • Net sales increased 4.2% to $1,486 million versus the 52 weeks ended December 25, 2021; excluding the 53rd week during 2022, net sales increased 3.1% to $1,471 million ◦ Hardware Solutions +13%; +12% excl. 53rd week ◦ Robotics and Digital Solutions ("RDS") ~flat; (1)% excl. 53rd week ◦ Canada +5%; +5% excl. 53rd week ◦ Protective Solutions (15)%; +1% excl. COVID-related PPE sales and 53rd week • GAAP net loss improved to $(16.4) million, or $(0.08) per diluted share, compared to a net loss of $(38.3) million, or $(0.28) per diluted share, versus the 52 weeks ended December 25, 2021 • Adjusted EBITDA totaled $210.2 million versus $207.4 million million in the 52 weeks ended December 25, 2021 2022 Financial Review Please see reconciliation of Adjusted EBITDA to Net Income in the Appendix of this presentation. Highlights for the 53 Weeks Ended December 31, 2022
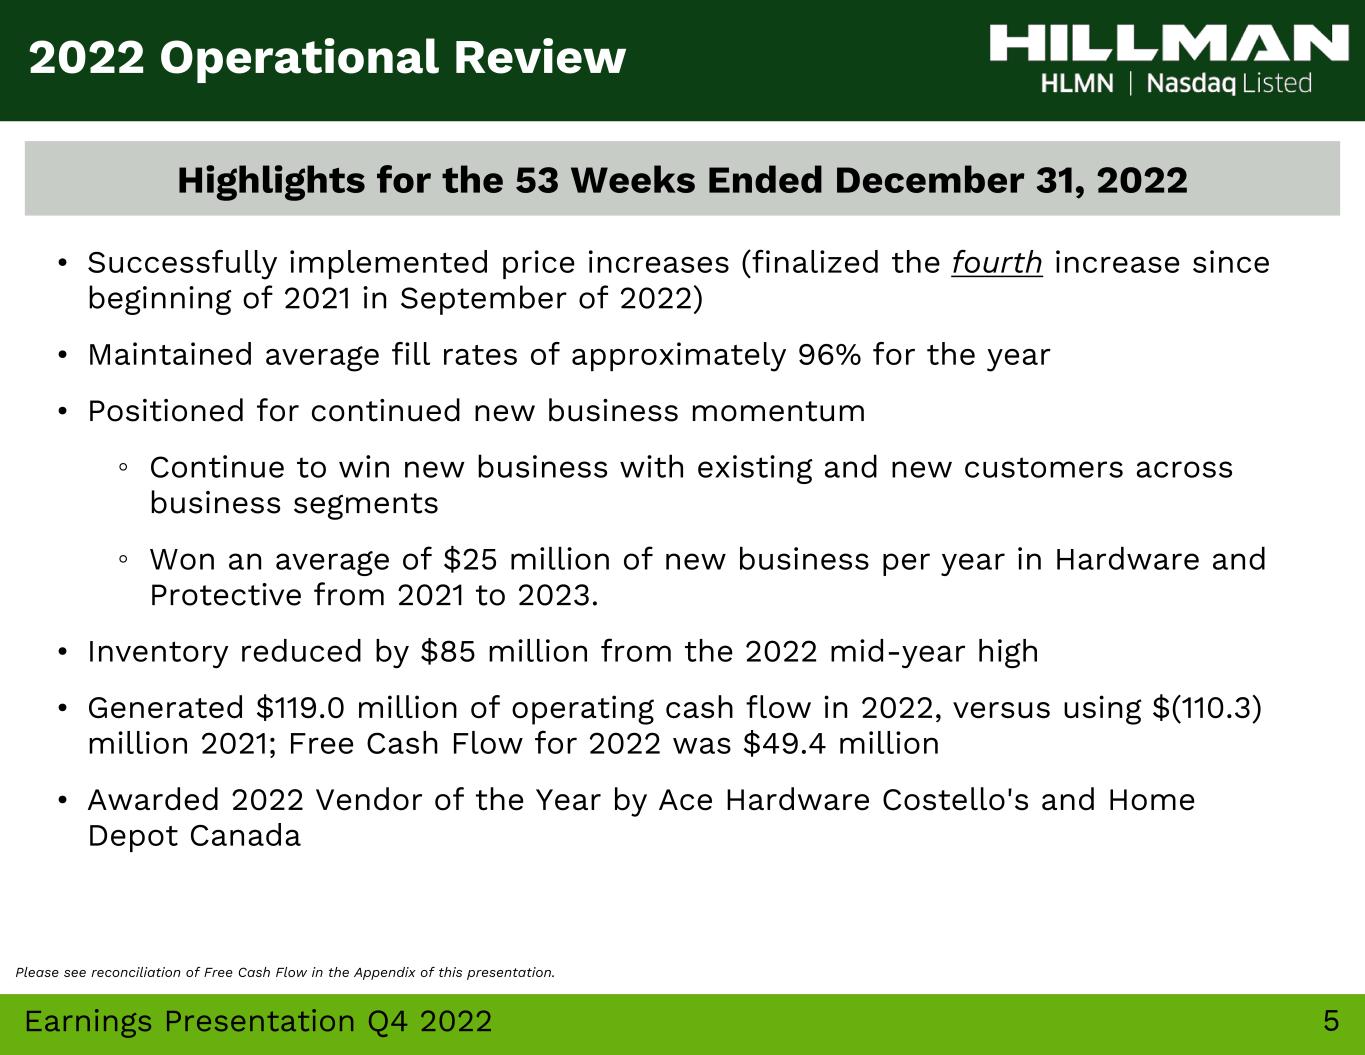
5Earnings Presentation Q4 2022 2022 Operational Review • Successfully implemented price increases (finalized the fourth increase since beginning of 2021 in September of 2022) • Maintained average fill rates of approximately 96% for the year • Positioned for continued new business momentum ◦ Continue to win new business with existing and new customers across business segments ◦ Won an average of $25 million of new business per year in Hardware and Protective from 2021 to 2023. • Inventory reduced by $85 million from the 2022 mid-year high • Generated $119.0 million of operating cash flow in 2022, versus using $(110.3) million 2021; Free Cash Flow for 2022 was $49.4 million • Awarded 2022 Vendor of the Year by Ace Hardware Costello's and Home Depot Canada Highlights for the 53 Weeks Ended December 31, 2022 Please see reconciliation of Free Cash Flow in the Appendix of this presentation.
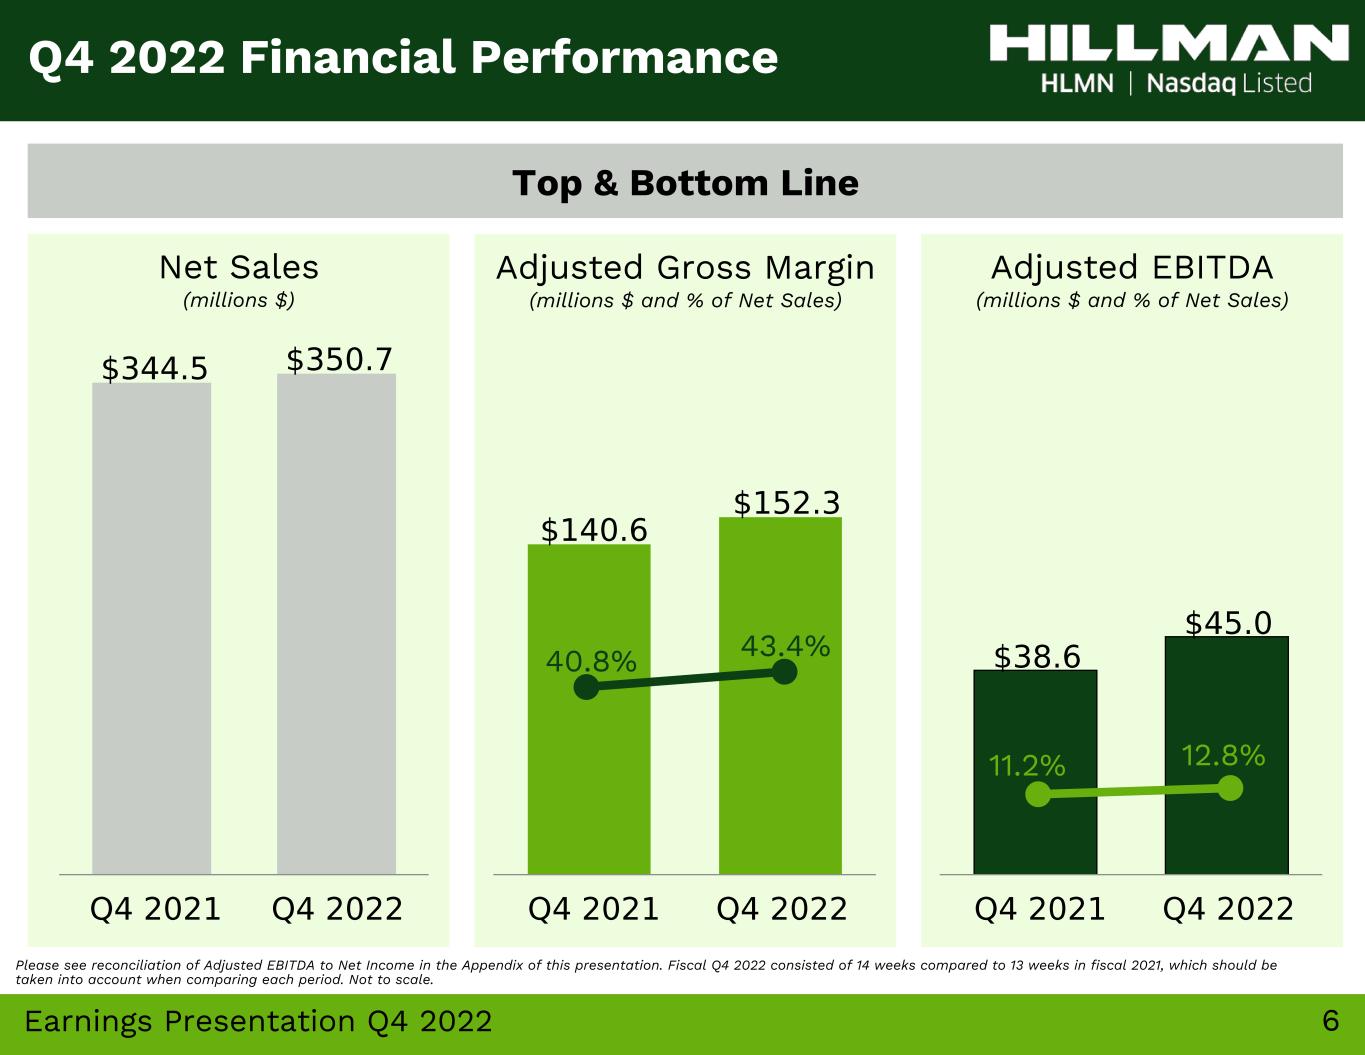
6Earnings Presentation Q4 2022 Adjusted EBITDA (millions $ and % of Net Sales) Please see reconciliation of Adjusted EBITDA to Net Income in the Appendix of this presentation. Fiscal Q4 2022 consisted of 14 weeks compared to 13 weeks in fiscal 2021, which should be taken into account when comparing each period. Not to scale. Top & Bottom Line Net Sales (millions $) Adjusted Gross Margin (millions $ and % of Net Sales) Q4 2022 Financial Performance 12.8%11.2% 43.4%40.8%
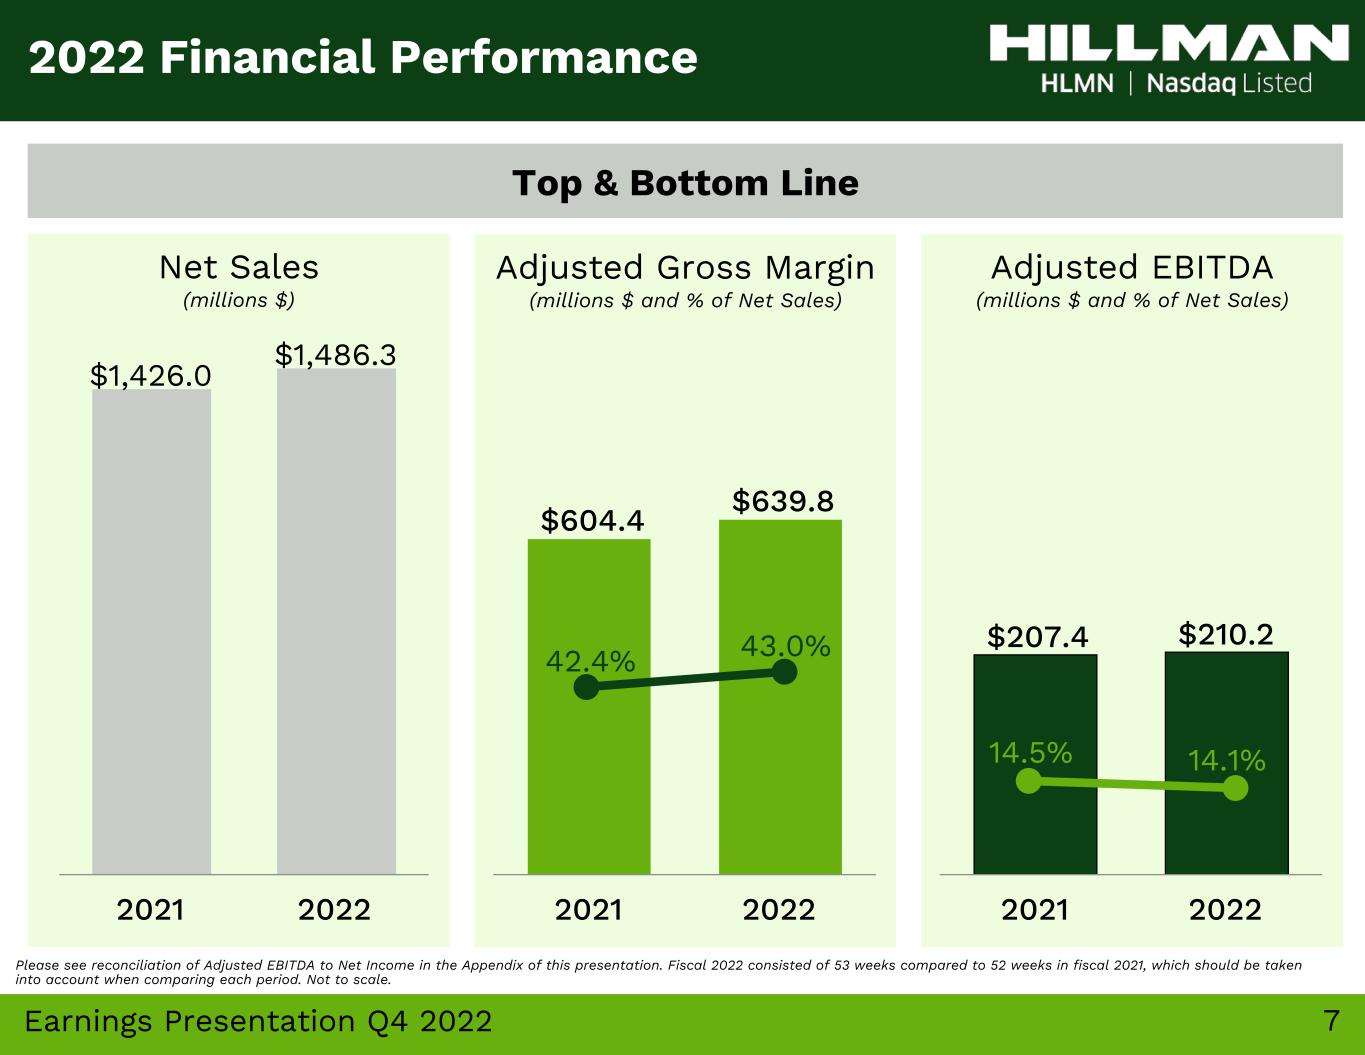
7Earnings Presentation Q4 2022 Adjusted EBITDA (millions $ and % of Net Sales) Top & Bottom Line Net Sales (millions $) Adjusted Gross Margin (millions $ and % of Net Sales) 2022 Financial Performance $207.4 $210.2 2021 2022 14.1%14.5% $604.4 $639.8 2021 2022 $1,426.0 $1,486.3 2021 2022 43.0%42.4% Please see reconciliation of Adjusted EBITDA to Net Income in the Appendix of this presentation. Fiscal 2022 consisted of 53 weeks compared to 52 weeks in fiscal 2021, which should be taken into account when comparing each period. Not to scale.
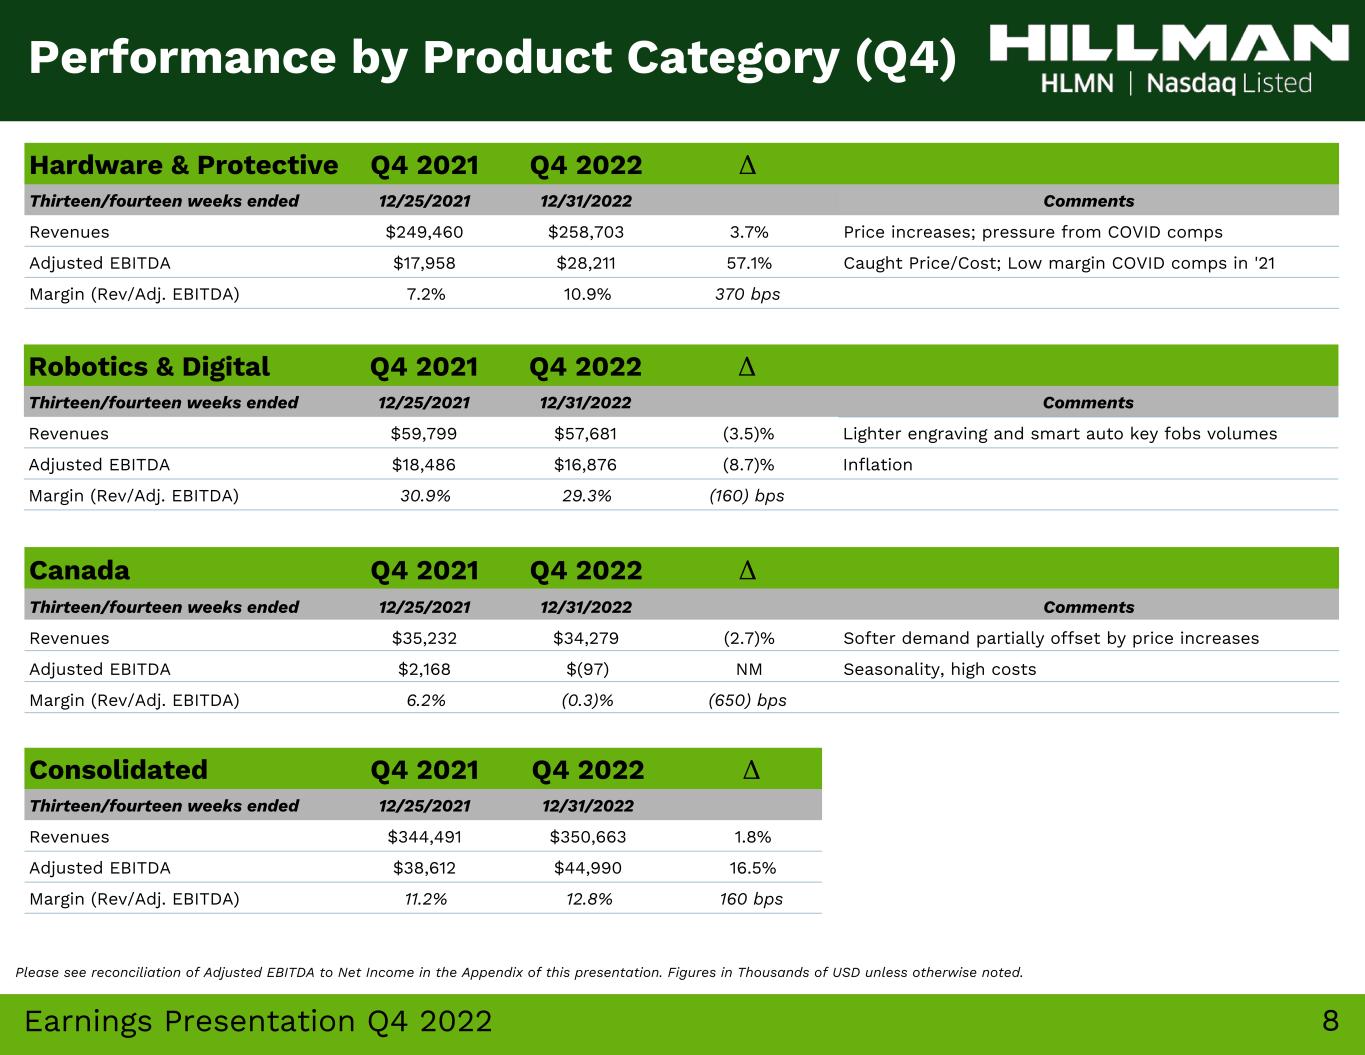
8Earnings Presentation Q4 2022 Hardware & Protective Q4 2021 Q4 2022 Δ Thirteen/fourteen weeks ended 12/25/2021 12/31/2022 Comments Revenues $249,460 $258,703 3.7% Price increases; pressure from COVID comps Adjusted EBITDA $17,958 $28,211 57.1% Caught Price/Cost; Low margin COVID comps in '21 Margin (Rev/Adj. EBITDA) 7.2% 10.9% 370 bps Robotics & Digital Q4 2021 Q4 2022 Δ Thirteen/fourteen weeks ended 12/25/2021 12/31/2022 Comments Revenues $59,799 $57,681 (3.5)% Lighter engraving and smart auto key fobs volumes Adjusted EBITDA $18,486 $16,876 (8.7)% Inflation Margin (Rev/Adj. EBITDA) 30.9% 29.3% (160) bps Canada Q4 2021 Q4 2022 Δ Thirteen/fourteen weeks ended 12/25/2021 12/31/2022 Comments Revenues $35,232 $34,279 (2.7)% Softer demand partially offset by price increases Adjusted EBITDA $2,168 $(97) NM Seasonality, high costs Margin (Rev/Adj. EBITDA) 6.2% (0.3)% (650) bps Consolidated Q4 2021 Q4 2022 Δ Thirteen/fourteen weeks ended 12/25/2021 12/31/2022 Revenues $344,491 $350,663 1.8% Adjusted EBITDA $38,612 $44,990 16.5% Margin (Rev/Adj. EBITDA) 11.2% 12.8% 160 bps Performance by Product Category (Q4) Please see reconciliation of Adjusted EBITDA to Net Income in the Appendix of this presentation. Figures in Thousands of USD unless otherwise noted.
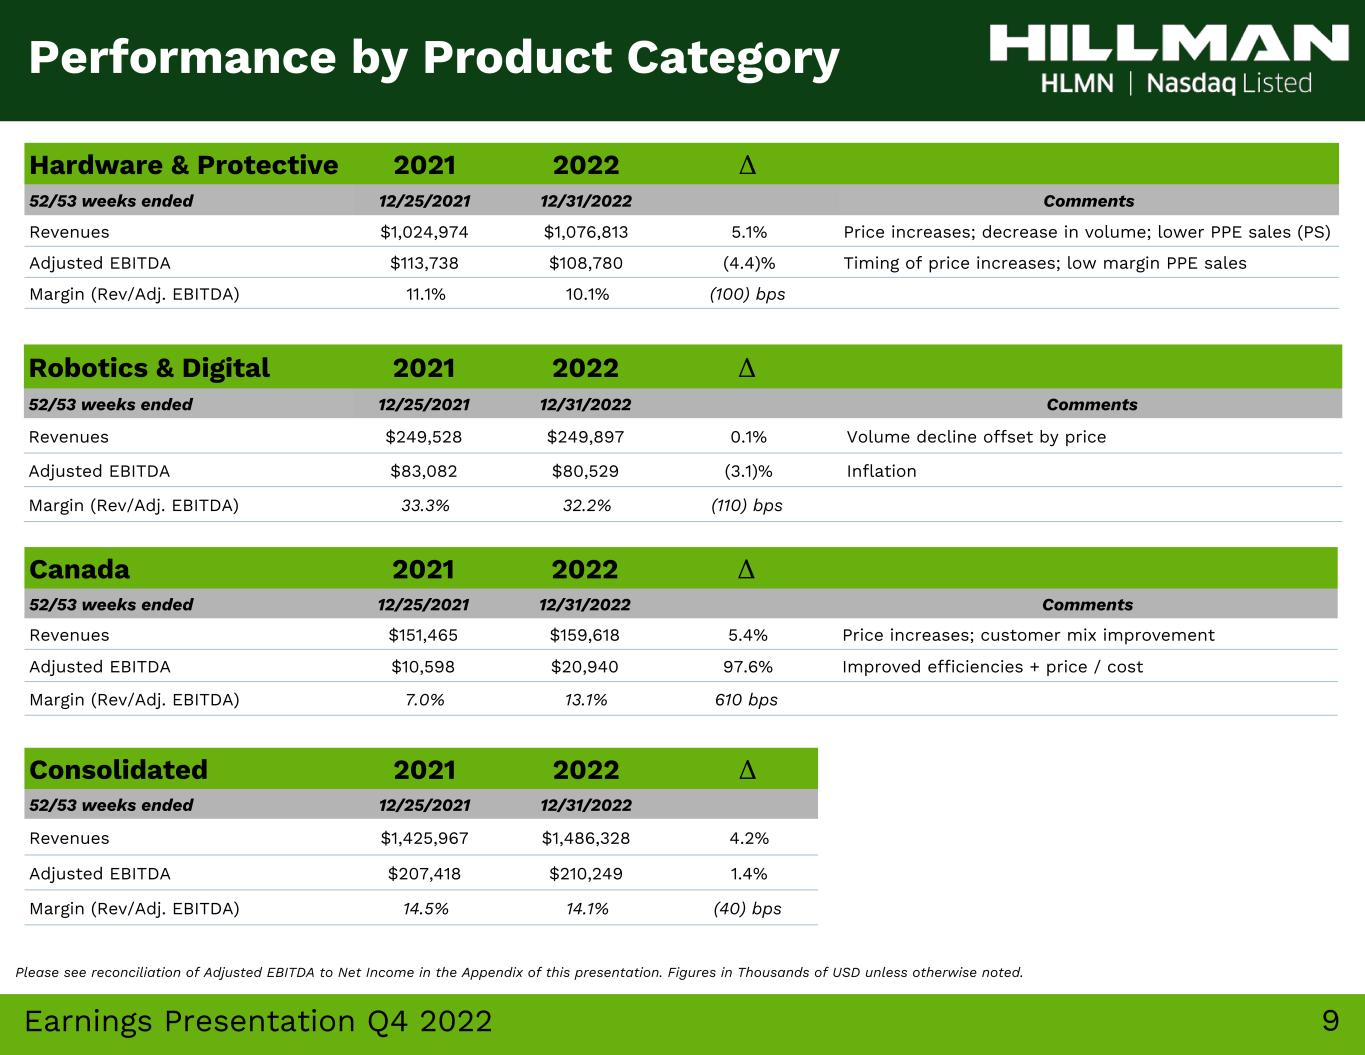
9Earnings Presentation Q4 2022 Hardware & Protective 2021 2022 Δ 52/53 weeks ended 12/25/2021 12/31/2022 Comments Revenues $1,024,974 $1,076,813 5.1% Price increases; decrease in volume; lower PPE sales (PS) Adjusted EBITDA $113,738 $108,780 (4.4)% Timing of price increases; low margin PPE sales Margin (Rev/Adj. EBITDA) 11.1% 10.1% (100) bps Robotics & Digital 2021 2022 Δ 52/53 weeks ended 12/25/2021 12/31/2022 Comments Revenues $249,528 $249,897 0.1% Volume decline offset by price Adjusted EBITDA $83,082 $80,529 (3.1)% Inflation Margin (Rev/Adj. EBITDA) 33.3% 32.2% (110) bps Canada 2021 2022 Δ 52/53 weeks ended 12/25/2021 12/31/2022 Comments Revenues $151,465 $159,618 5.4% Price increases; customer mix improvement Adjusted EBITDA $10,598 $20,940 97.6% Improved efficiencies + price / cost Margin (Rev/Adj. EBITDA) 7.0% 13.1% 610 bps Consolidated 2021 2022 Δ 52/53 weeks ended 12/25/2021 12/31/2022 Revenues $1,425,967 $1,486,328 4.2% Adjusted EBITDA $207,418 $210,249 1.4% Margin (Rev/Adj. EBITDA) 14.5% 14.1% (40) bps Performance by Product Category Please see reconciliation of Adjusted EBITDA to Net Income in the Appendix of this presentation. Figures in Thousands of USD unless otherwise noted.
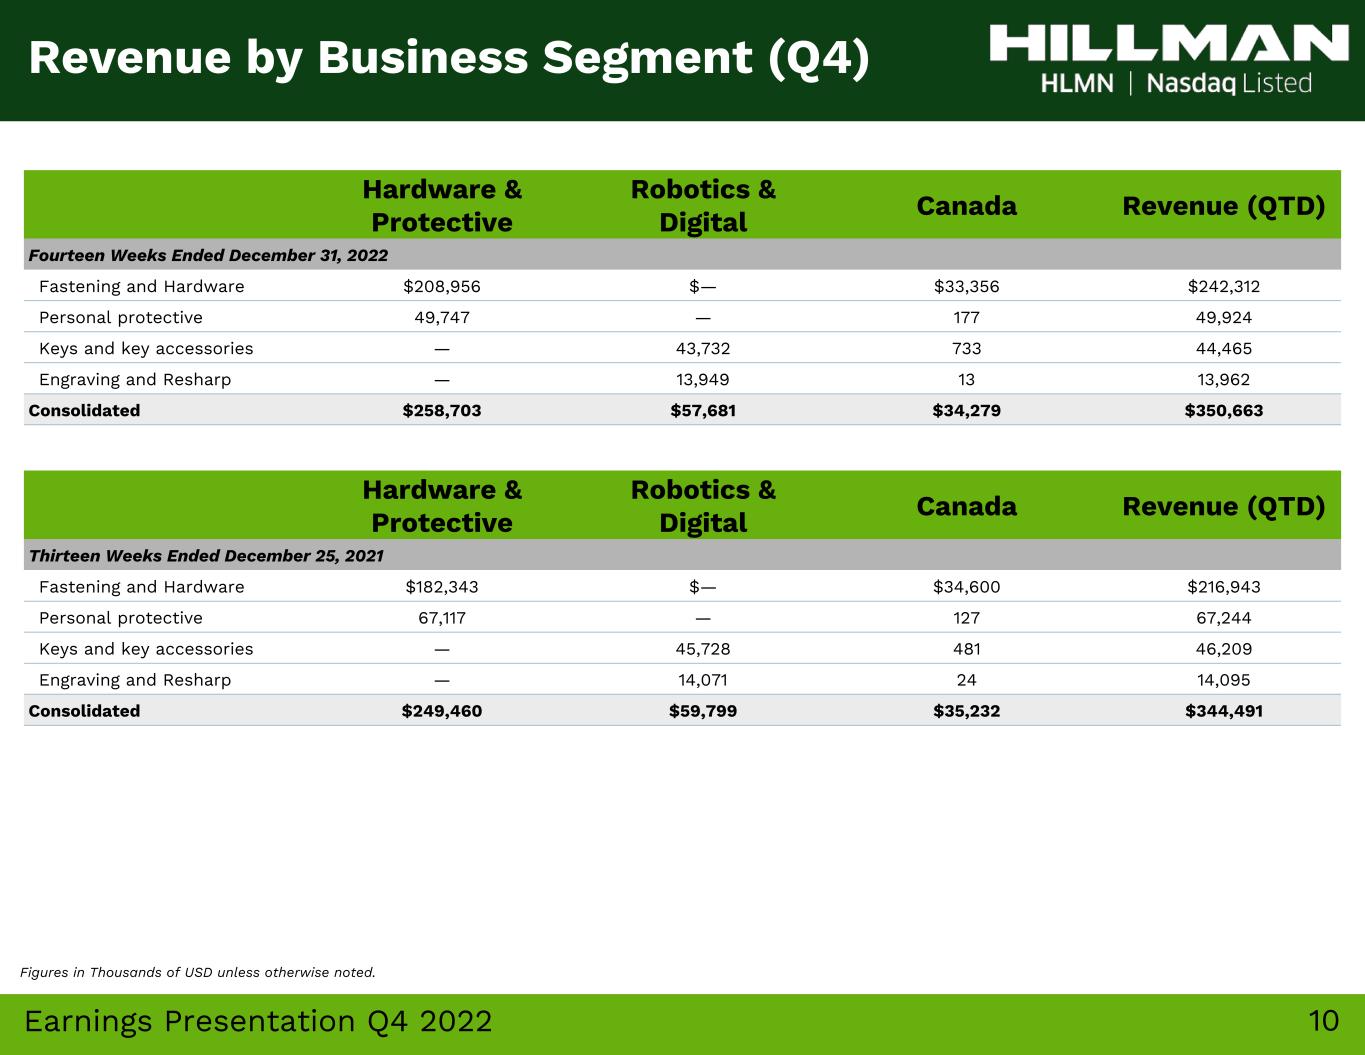
10Earnings Presentation Q4 2022 Hardware & Protective Robotics & Digital Canada Revenue (QTD) Fourteen Weeks Ended December 31, 2022 Fastening and Hardware $208,956 $— $33,356 $242,312 Personal protective 49,747 — 177 49,924 Keys and key accessories — 43,732 733 44,465 Engraving and Resharp — 13,949 13 13,962 Consolidated $258,703 $57,681 $34,279 $350,663 Revenue by Business Segment (Q4) Hardware & Protective Robotics & Digital Canada Revenue (QTD) Thirteen Weeks Ended December 25, 2021 Fastening and Hardware $182,343 $— $34,600 $216,943 Personal protective 67,117 — 127 67,244 Keys and key accessories — 45,728 481 46,209 Engraving and Resharp — 14,071 24 14,095 Consolidated $249,460 $59,799 $35,232 $344,491 Figures in Thousands of USD unless otherwise noted.
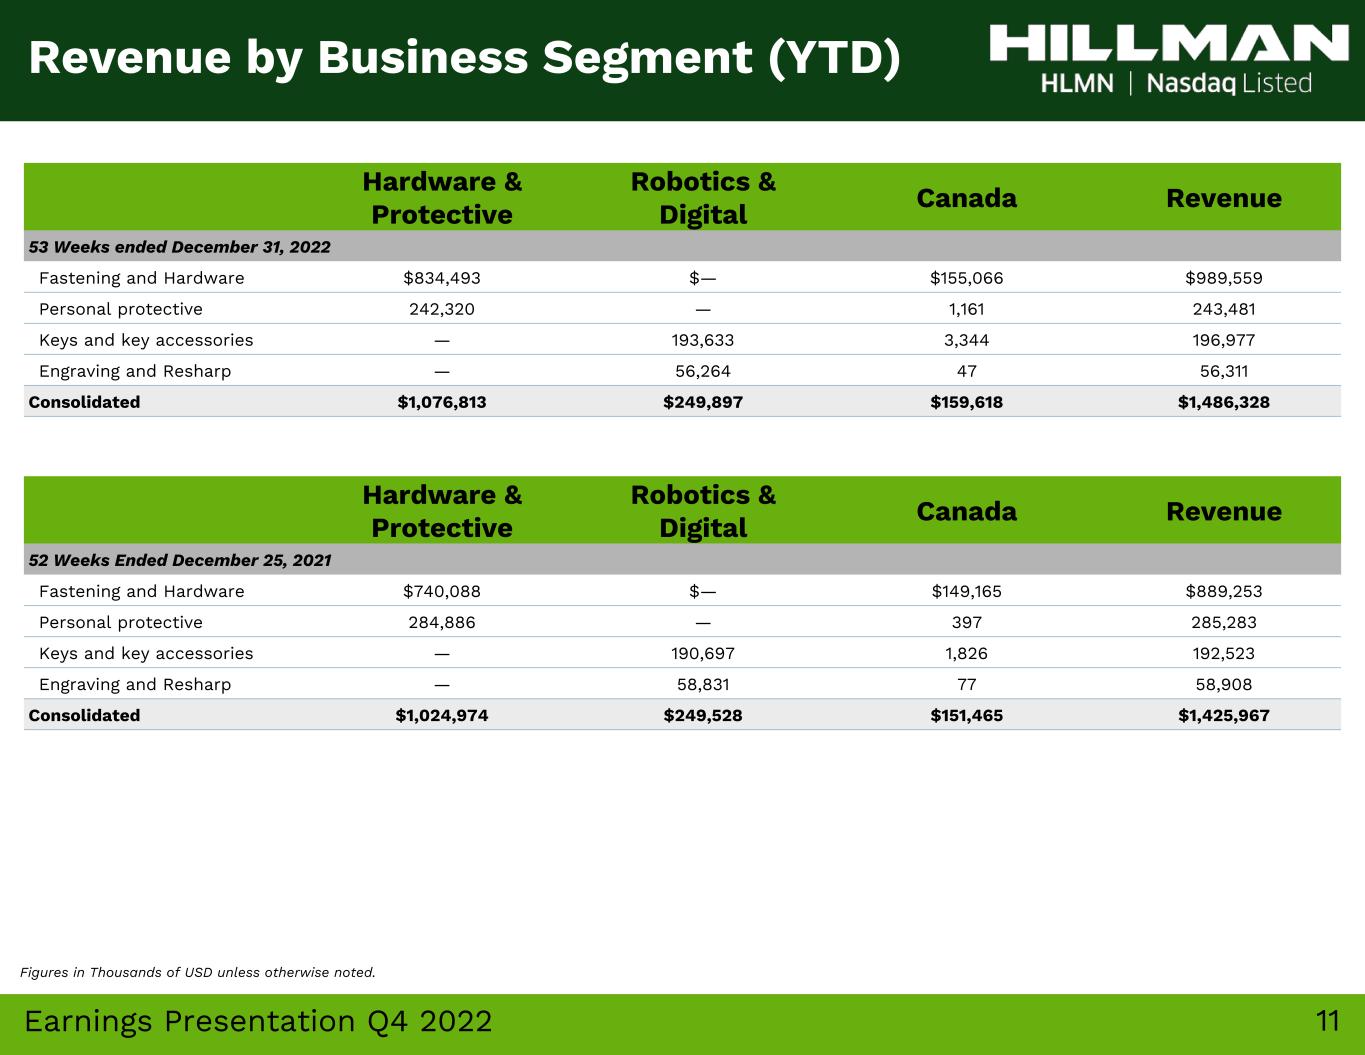
11Earnings Presentation Q4 2022 Hardware & Protective Robotics & Digital Canada Revenue 53 Weeks ended December 31, 2022 Fastening and Hardware $834,493 $— $155,066 $989,559 Personal protective 242,320 — 1,161 243,481 Keys and key accessories — 193,633 3,344 196,977 Engraving and Resharp — 56,264 47 56,311 Consolidated $1,076,813 $249,897 $159,618 $1,486,328 Revenue by Business Segment (YTD) Hardware & Protective Robotics & Digital Canada Revenue 52 Weeks Ended December 25, 2021 Fastening and Hardware $740,088 $— $149,165 $889,253 Personal protective 284,886 — 397 285,283 Keys and key accessories — 190,697 1,826 192,523 Engraving and Resharp — 58,831 77 58,908 Consolidated $1,024,974 $249,528 $151,465 $1,425,967 Figures in Thousands of USD unless otherwise noted.
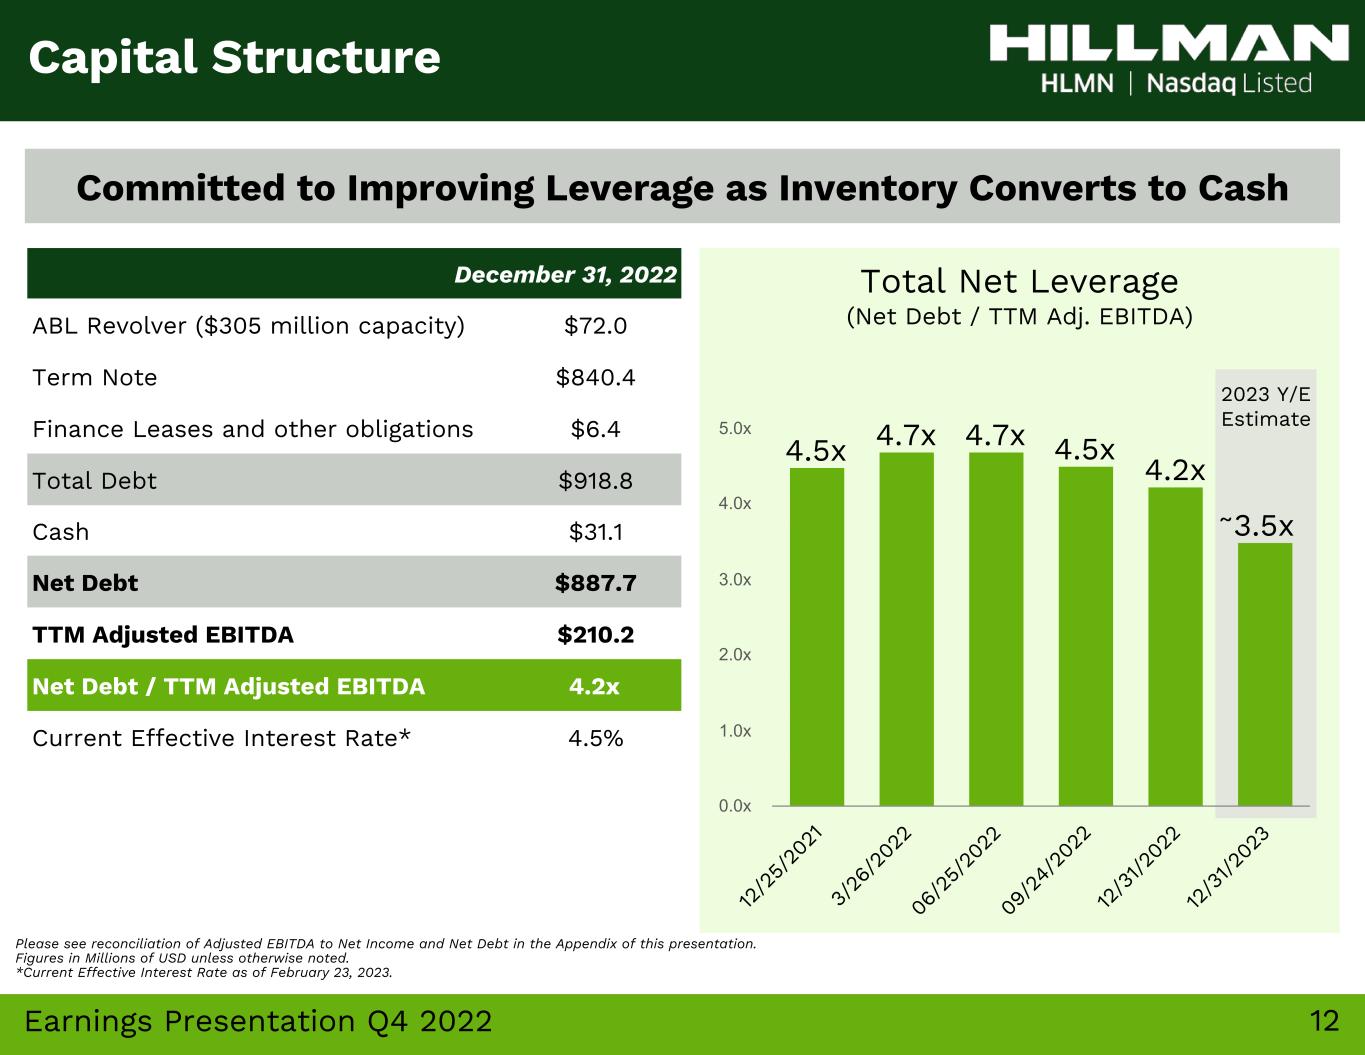
12Earnings Presentation Q4 2022 Total Net Leverage (Net Debt / TTM Adj. EBITDA) Capital Structure Committed to Improving Leverage as Inventory Converts to Cash Please see reconciliation of Adjusted EBITDA to Net Income and Net Debt in the Appendix of this presentation. Figures in Millions of USD unless otherwise noted. *Current Effective Interest Rate as of February 23, 2023. 2023 Y/E Estimate 4.5x 4.7x 4.7x 4.5x 4.2x 3.5x 12 /2 5/ 20 21 3/ 26 /2 02 2 06 /2 5/ 20 22 09 /2 4/ 20 22 12 /3 1/2 02 2 12 /3 1/2 02 3 0.0x 1.0x 2.0x 3.0x 4.0x 5.0x December 31, 2022 ABL Revolver ($305 million capacity) $72.0 Term Note $840.4 Finance Leases and other obligations $6.4 Total Debt $918.8 Cash $31.1 Net Debt $887.7 TTM Adjusted EBITDA $210.2 Net Debt / TTM Adjusted EBITDA 4.2x Current Effective Interest Rate* 4.5% ~
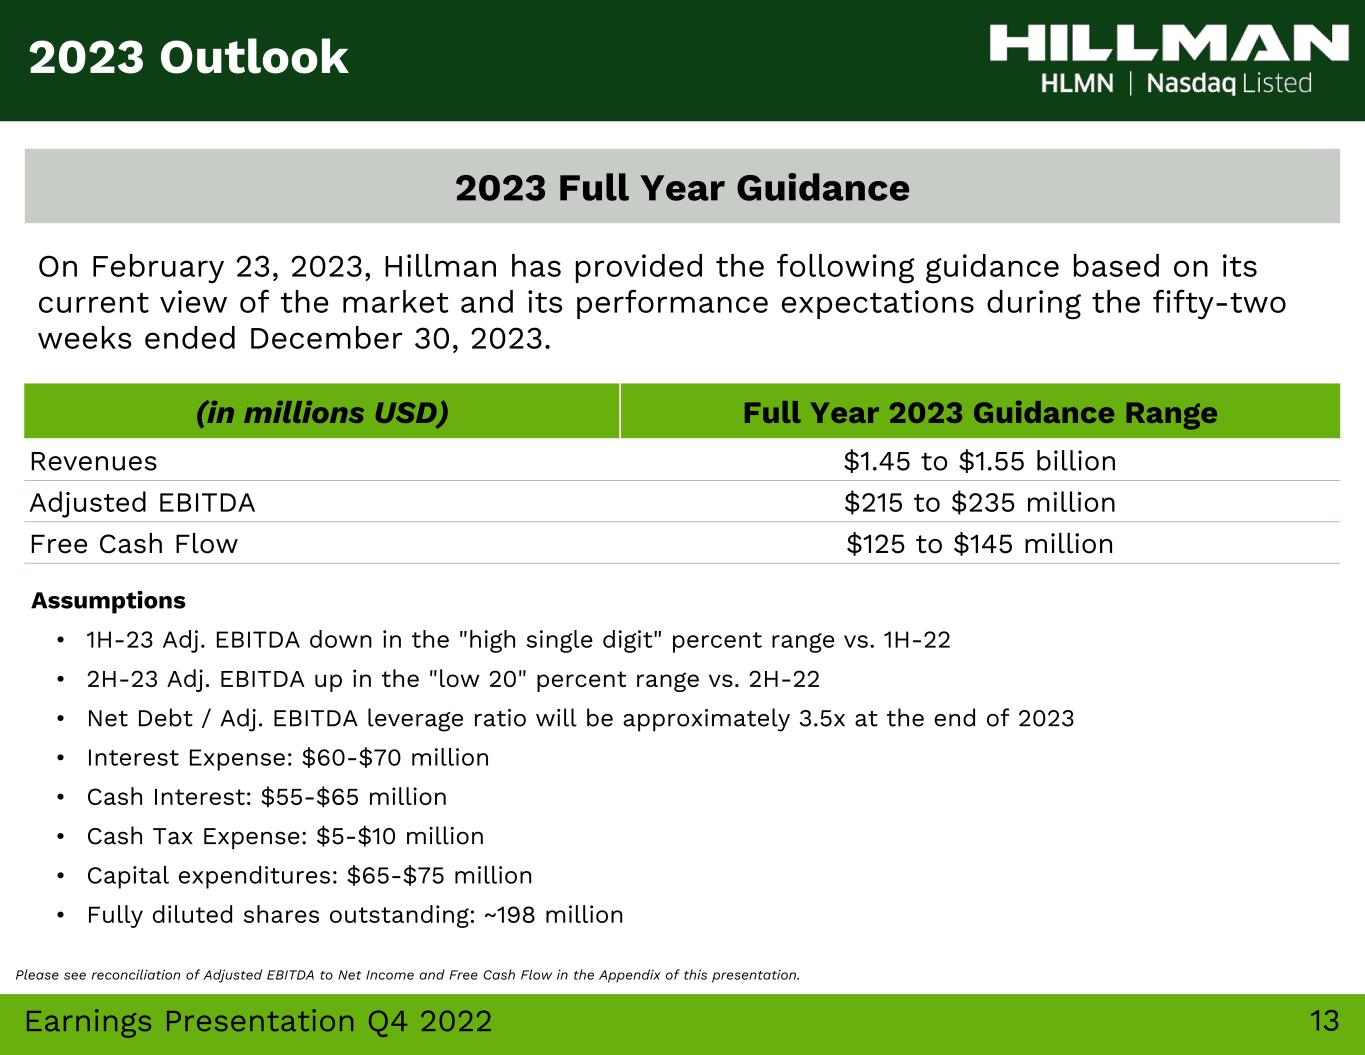
13Earnings Presentation Q4 2022 (in millions USD) Full Year 2023 Guidance Range Revenues $1.45 to $1.55 billion Adjusted EBITDA $215 to $235 million Free Cash Flow $125 to $145 million Assumptions • 1H-23 Adj. EBITDA down in the "high single digit" percent range vs. 1H-22 • 2H-23 Adj. EBITDA up in the "low 20" percent range vs. 2H-22 • Net Debt / Adj. EBITDA leverage ratio will be approximately 3.5x at the end of 2023 • Interest Expense: $60-$70 million • Cash Interest: $55-$65 million • Cash Tax Expense: $5-$10 million • Capital expenditures: $65-$75 million • Fully diluted shares outstanding: ~198 million 2023 Outlook On February 23, 2023, Hillman has provided the following guidance based on its current view of the market and its performance expectations during the fifty-two weeks ended December 30, 2023. 2023 Full Year Guidance Please see reconciliation of Adjusted EBITDA to Net Income and Free Cash Flow in the Appendix of this presentation.
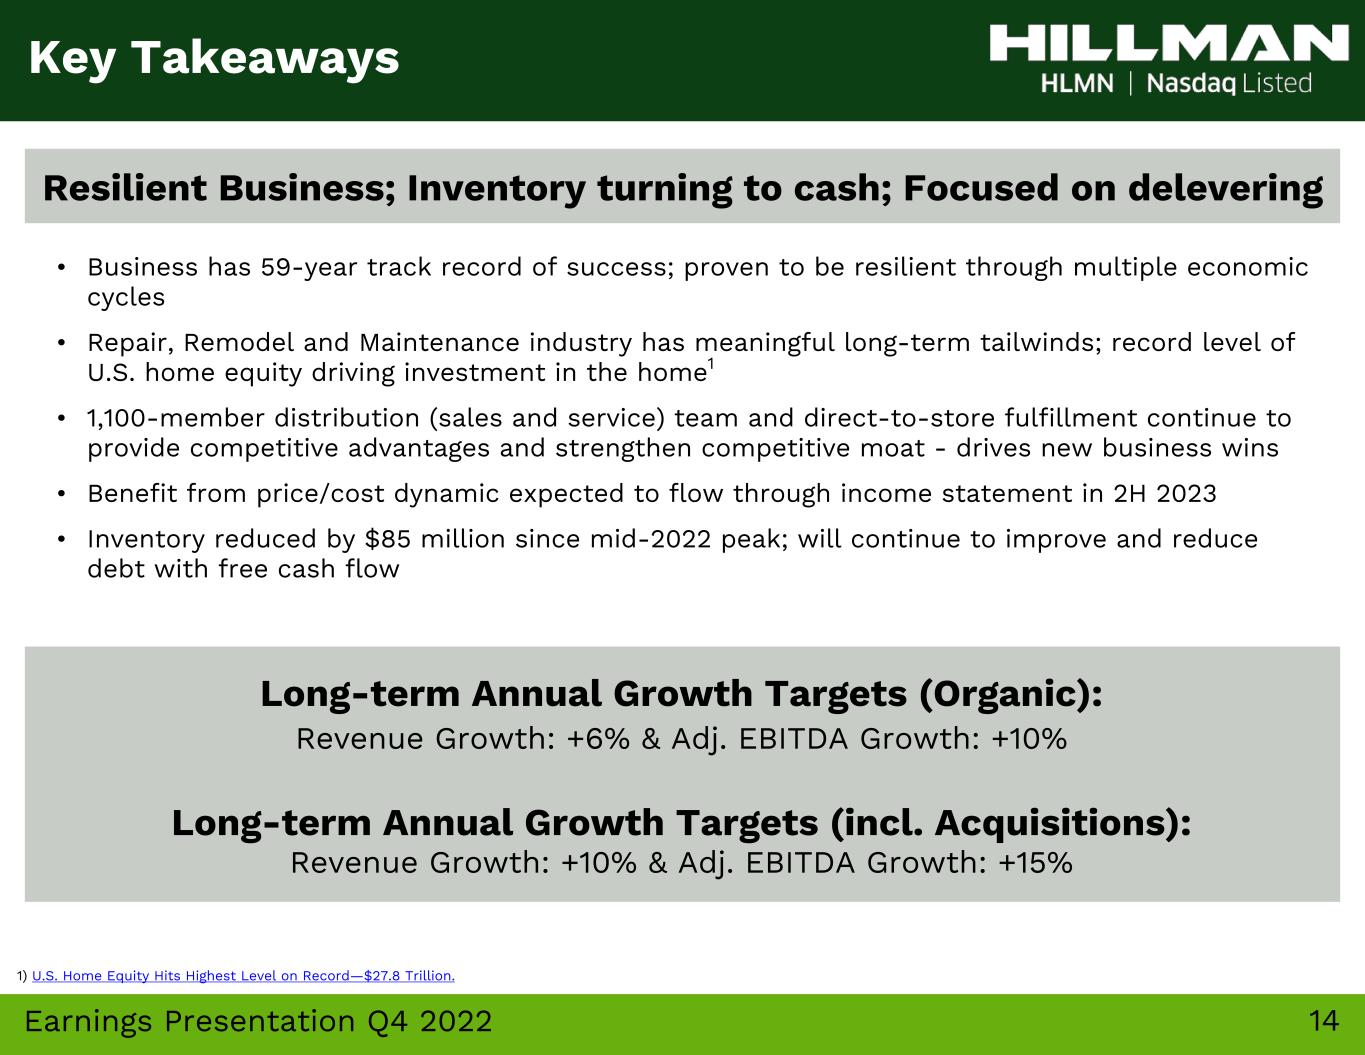
14Earnings Presentation Q4 2022 Key Takeaways Resilient Business; Inventory turning to cash; Focused on delevering Long-term Annual Growth Targets (Organic): Revenue Growth: +6% & Adj. EBITDA Growth: +10% Long-term Annual Growth Targets (incl. Acquisitions): Revenue Growth: +10% & Adj. EBITDA Growth: +15% • Business has 59-year track record of success; proven to be resilient through multiple economic cycles • Repair, Remodel and Maintenance industry has meaningful long-term tailwinds; record level of U.S. home equity driving investment in the home1 • 1,100-member distribution (sales and service) team and direct-to-store fulfillment continue to provide competitive advantages and strengthen competitive moat - drives new business wins • Benefit from price/cost dynamic expected to flow through income statement in 2H 2023 • Inventory reduced by $85 million since mid-2022 peak; will continue to improve and reduce debt with free cash flow 1) U.S. Home Equity Hits Highest Level on Record—$27.8 Trillion.
15 Appendix
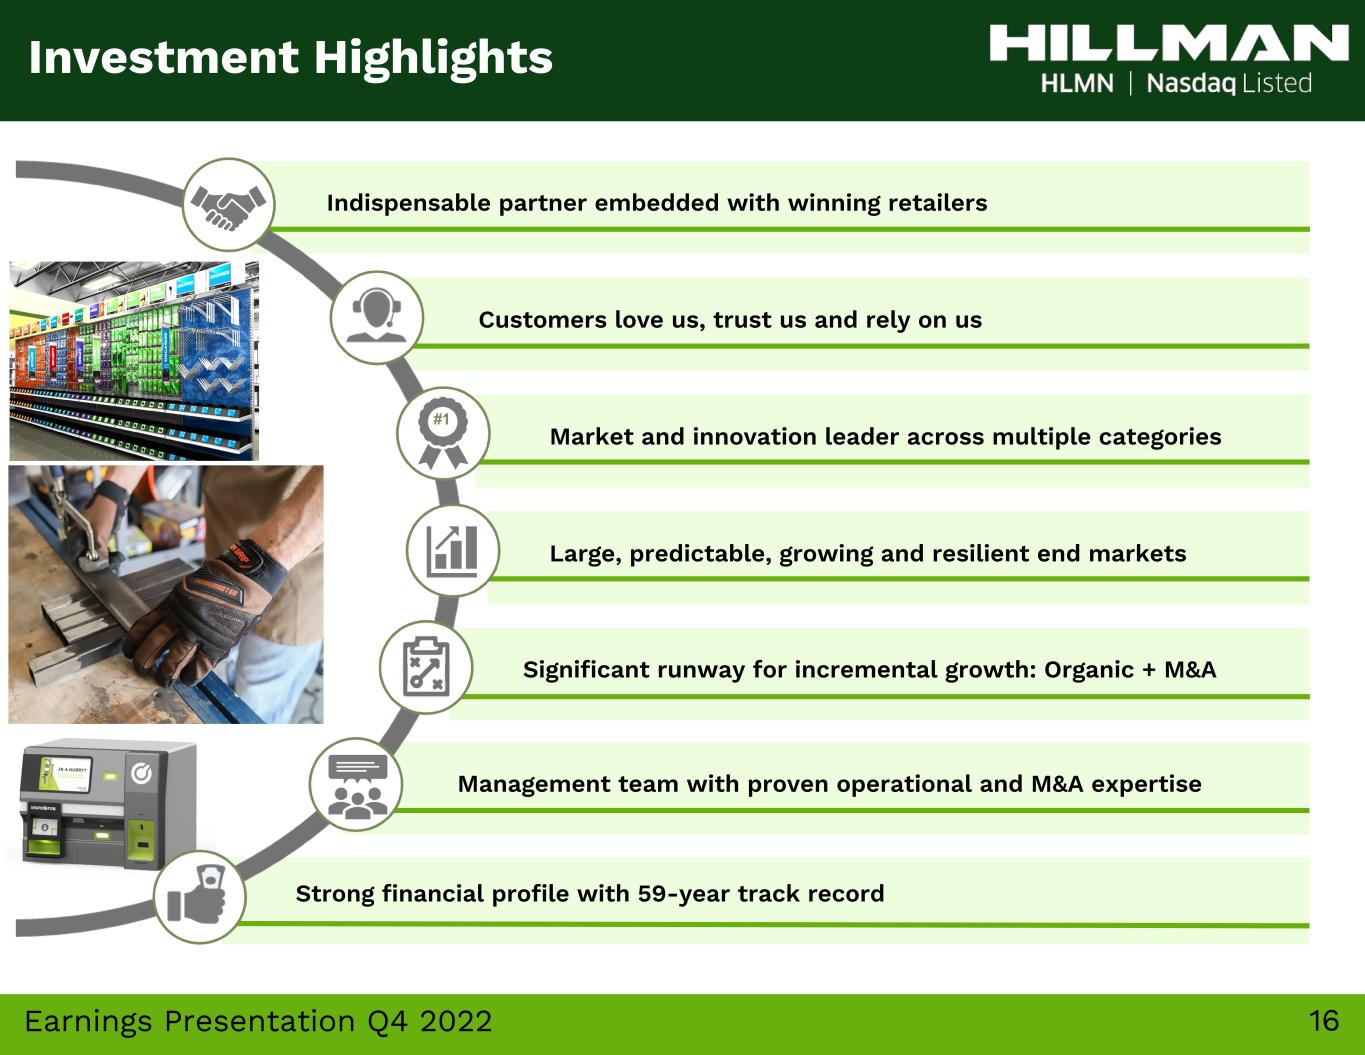
16Earnings Presentation Q4 2022 Significant runway for incremental growth: Organic + M&A Management team with proven operational and M&A expertise Strong financial profile with 59-year track record Market and innovation leader across multiple categories Indispensable partner embedded with winning retailers Customers love us, trust us and rely on us Large, predictable, growing and resilient end markets Investment Highlights
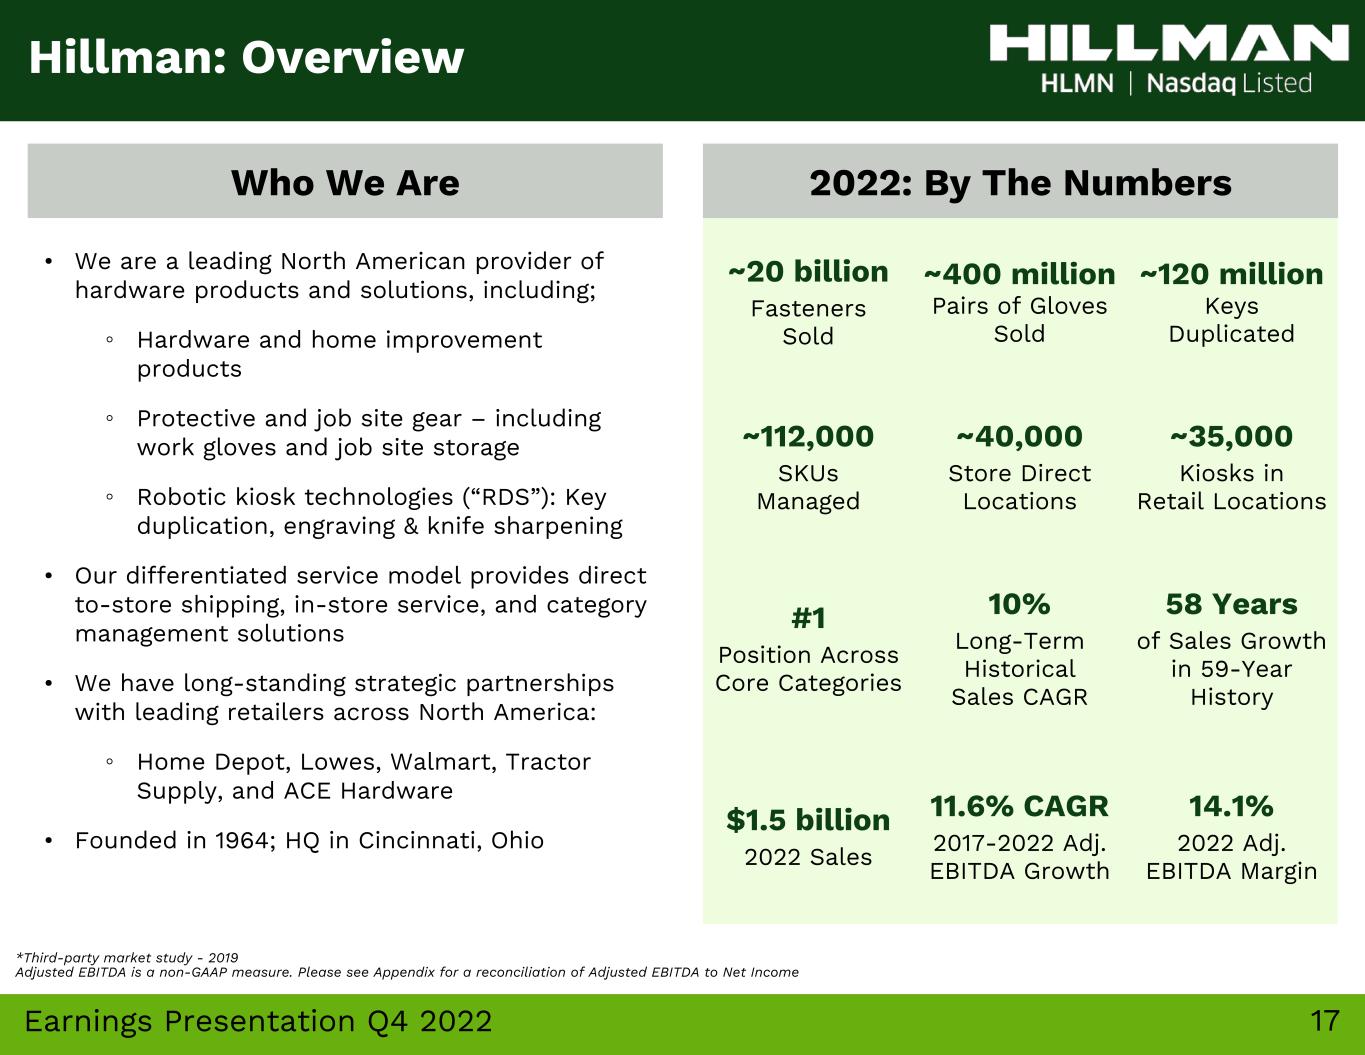
17Earnings Presentation Q4 2022 Who We Are *Third-party market study - 2019 Adjusted EBITDA is a non-GAAP measure. Please see Appendix for a reconciliation of Adjusted EBITDA to Net Income ~20 billion Fasteners Sold ~400 million Pairs of Gloves Sold ~120 million Keys Duplicated ~112,000 SKUs Managed ~40,000 Store Direct Locations ~35,000 Kiosks in Retail Locations #1 Position Across Core Categories 10% Long-Term Historical Sales CAGR 58 Years of Sales Growth in 59-Year History $1.5 billion 2022 Sales 11.6% CAGR 2017-2022 Adj. EBITDA Growth 14.1% 2022 Adj. EBITDA Margin Hillman: Overview 2022: By The Numbers • We are a leading North American provider of hardware products and solutions, including; ◦ Hardware and home improvement products ◦ Protective and job site gear – including work gloves and job site storage ◦ Robotic kiosk technologies (“RDS”): Key duplication, engraving & knife sharpening • Our differentiated service model provides direct to-store shipping, in-store service, and category management solutions • We have long-standing strategic partnerships with leading retailers across North America: ◦ Home Depot, Lowes, Walmart, Tractor Supply, and ACE Hardware • Founded in 1964; HQ in Cincinnati, Ohio
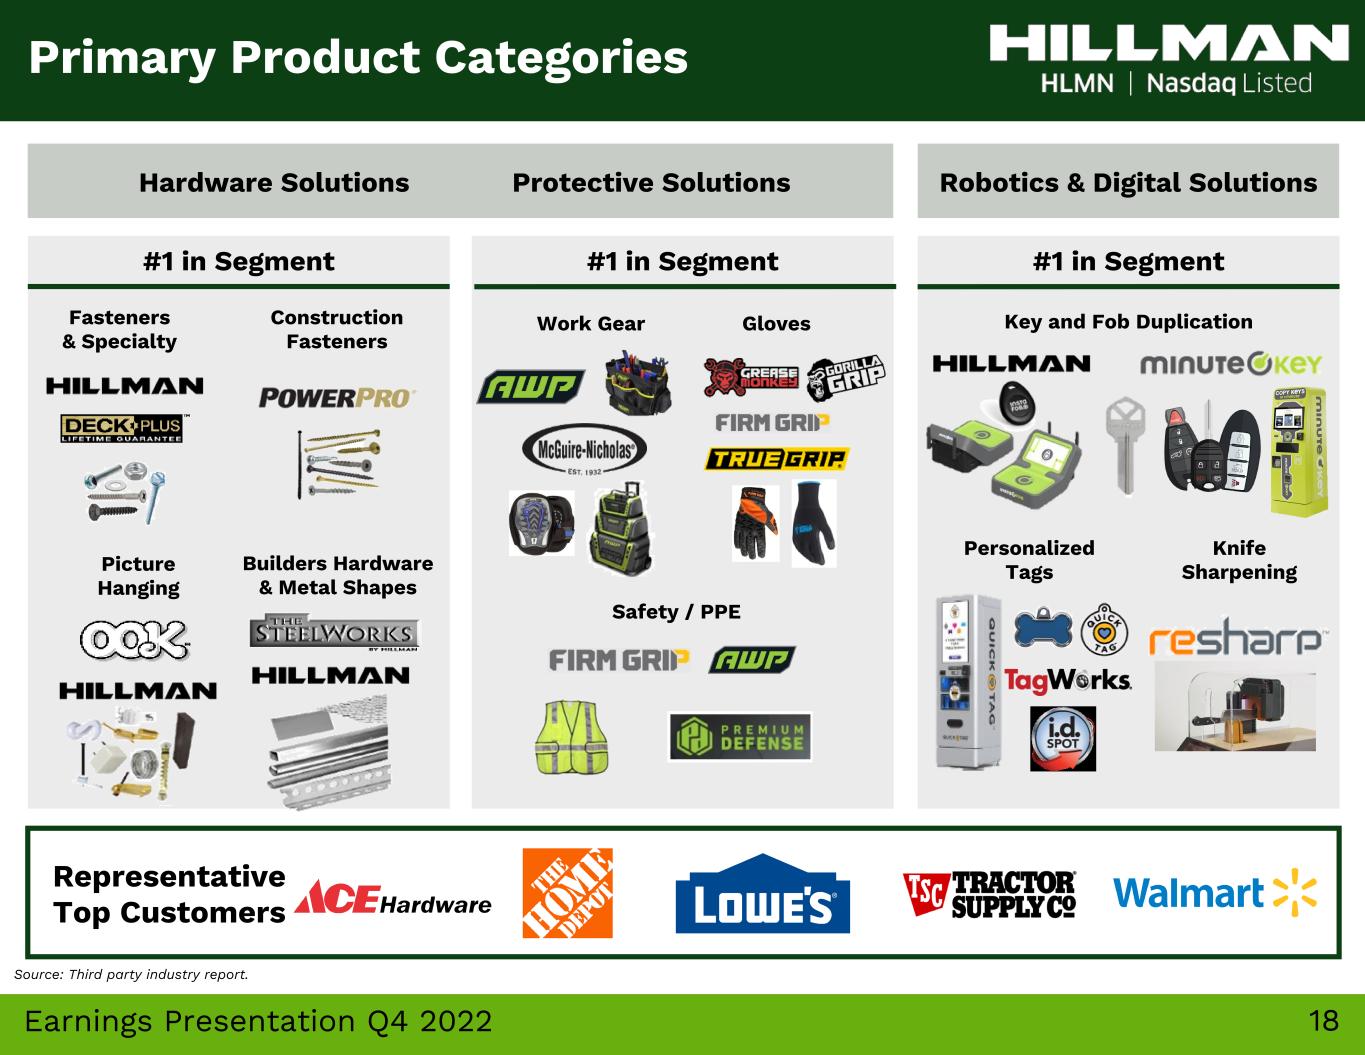
18Earnings Presentation Q4 2022 #1 in Segment Representative Top Customers #1 in Segment #1 in Segment Key and Fob Duplication Personalized Tags Knife Sharpening Fasteners & Specialty Gloves Builders Hardware & Metal Shapes Safety / PPE Construction Fasteners Work Gear Picture Hanging Source: Third party industry report. Primary Product Categories Hardware Solutions Protective Solutions Robotics & Digital Solutions
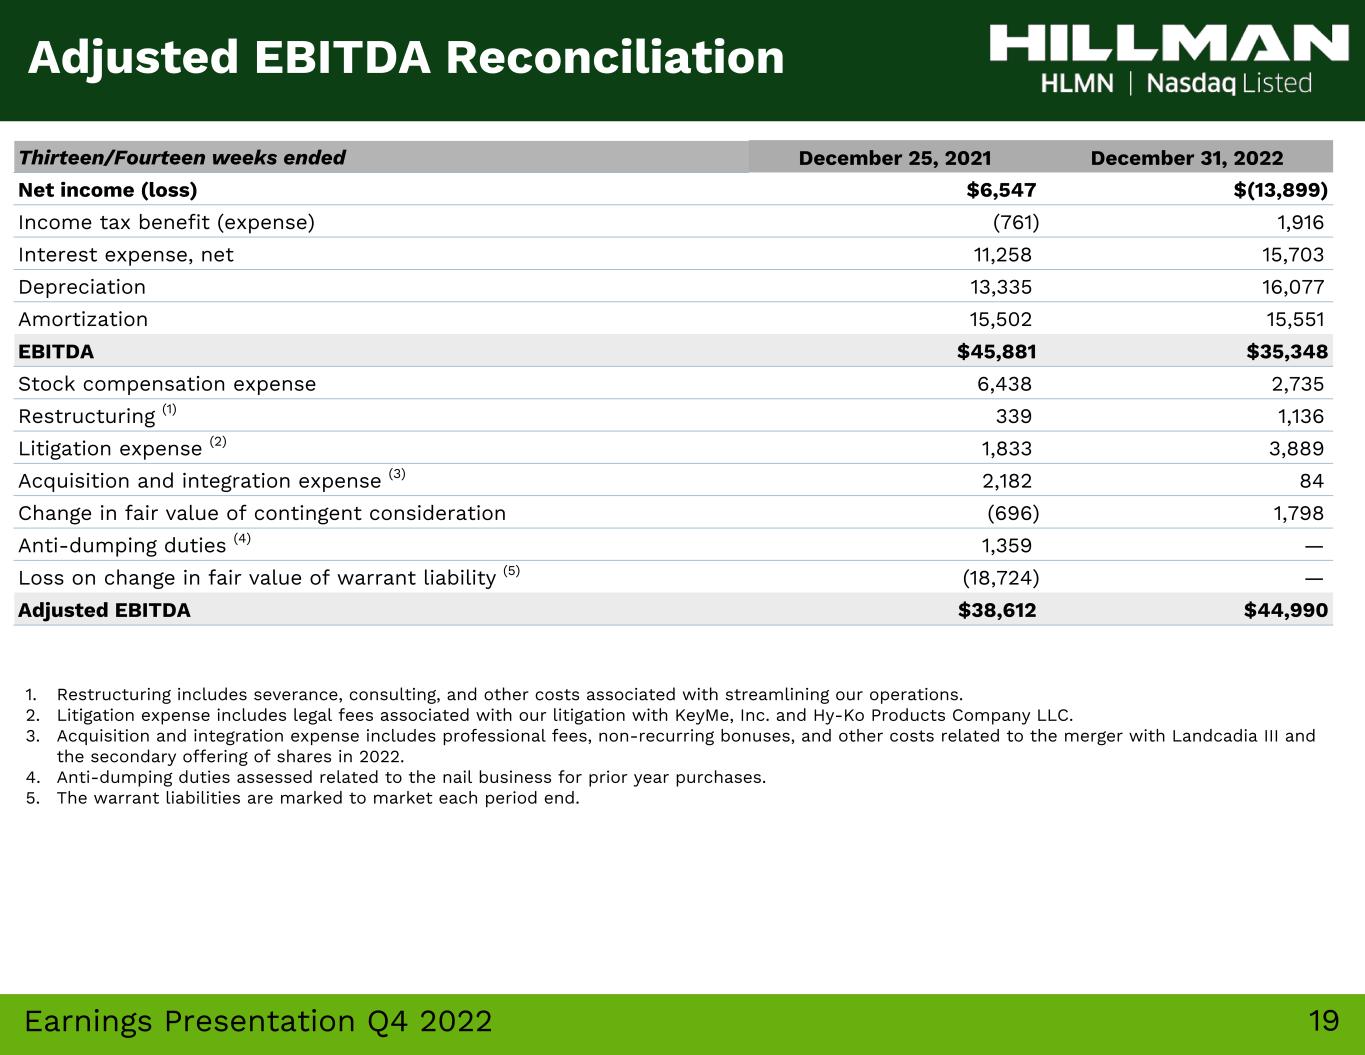
19Earnings Presentation Q4 2022 Thirteen/Fourteen weeks ended December 25, 2021 December 31, 2022 Net income (loss) $6,547 $(13,899) Income tax benefit (expense) (761) 1,916 Interest expense, net 11,258 15,703 Depreciation 13,335 16,077 Amortization 15,502 15,551 EBITDA $45,881 $35,348 Stock compensation expense 6,438 2,735 Restructuring (1) 339 1,136 Litigation expense (2) 1,833 3,889 Acquisition and integration expense (3) 2,182 84 Change in fair value of contingent consideration (696) 1,798 Anti-dumping duties (4) 1,359 — Loss on change in fair value of warrant liability (5) (18,724) — Adjusted EBITDA $38,612 $44,990 1. Restructuring includes severance, consulting, and other costs associated with streamlining our operations. 2. Litigation expense includes legal fees associated with our litigation with KeyMe, Inc. and Hy-Ko Products Company LLC. 3. Acquisition and integration expense includes professional fees, non-recurring bonuses, and other costs related to the merger with Landcadia III and the secondary offering of shares in 2022. 4. Anti-dumping duties assessed related to the nail business for prior year purchases. 5. The warrant liabilities are marked to market each period end. Adjusted EBITDA Reconciliation
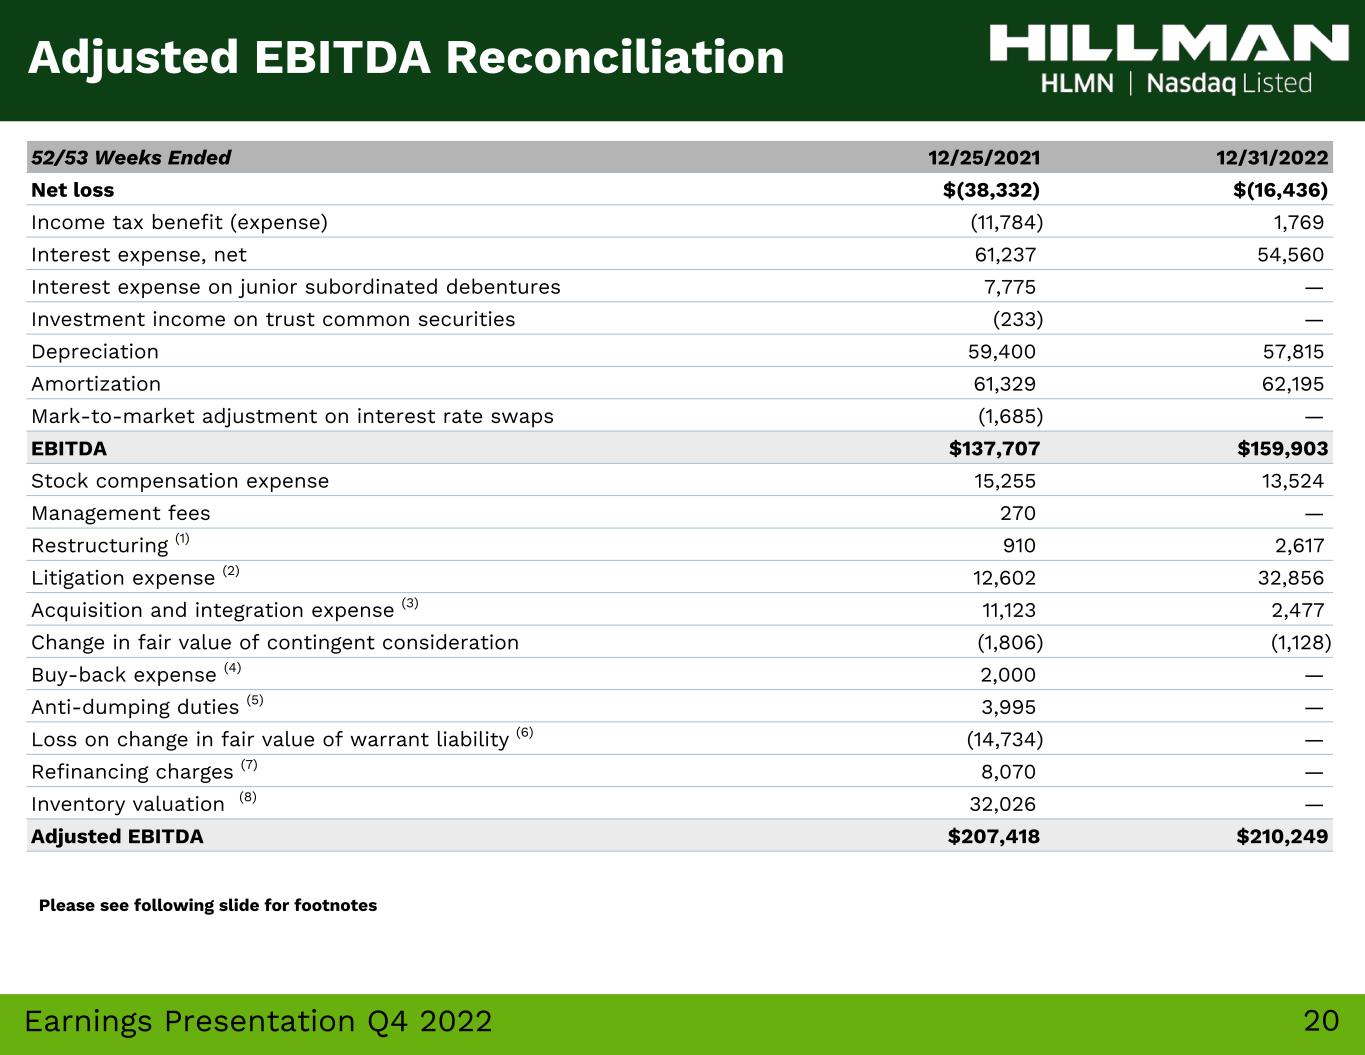
20Earnings Presentation Q4 2022 52/53 Weeks Ended 12/25/2021 12/31/2022 Net loss $(38,332) $(16,436) Income tax benefit (expense) (11,784) 1,769 Interest expense, net 61,237 54,560 Interest expense on junior subordinated debentures 7,775 — Investment income on trust common securities (233) — Depreciation 59,400 57,815 Amortization 61,329 62,195 Mark-to-market adjustment on interest rate swaps (1,685) — EBITDA $137,707 $159,903 Stock compensation expense 15,255 13,524 Management fees 270 — Restructuring (1) 910 2,617 Litigation expense (2) 12,602 32,856 Acquisition and integration expense (3) 11,123 2,477 Change in fair value of contingent consideration (1,806) (1,128) Buy-back expense (4) 2,000 — Anti-dumping duties (5) 3,995 — Loss on change in fair value of warrant liability (6) (14,734) — Refinancing charges (7) 8,070 — Inventory valuation (8) 32,026 — Adjusted EBITDA $207,418 $210,249 Please see following slide for footnotes Adjusted EBITDA Reconciliation
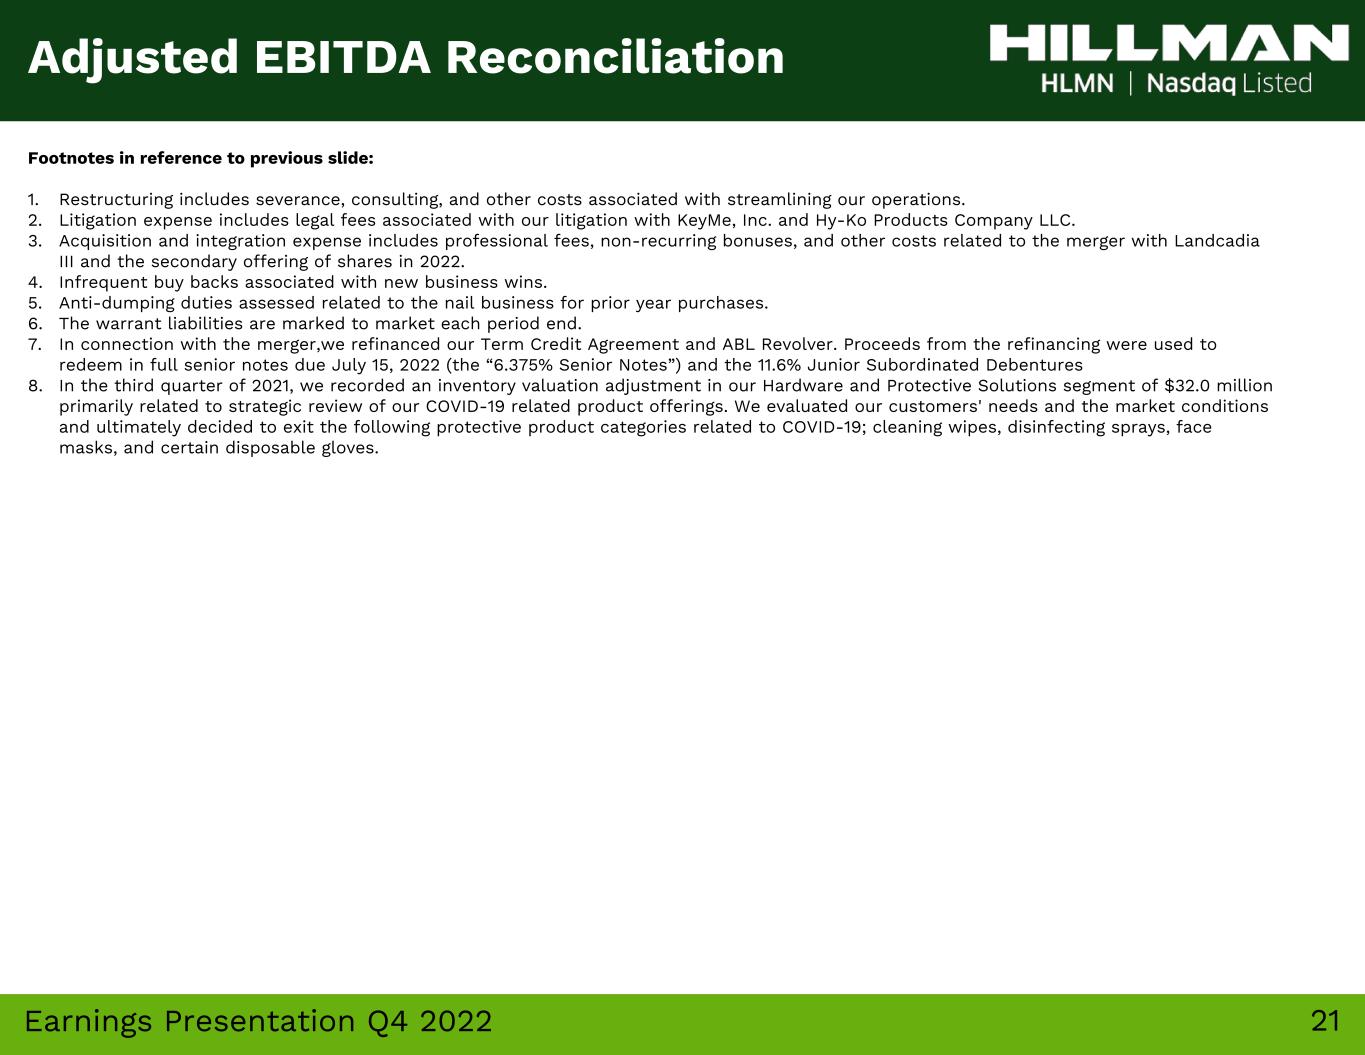
21Earnings Presentation Q4 2022 Footnotes in reference to previous slide: 1. Restructuring includes severance, consulting, and other costs associated with streamlining our operations. 2. Litigation expense includes legal fees associated with our litigation with KeyMe, Inc. and Hy-Ko Products Company LLC. 3. Acquisition and integration expense includes professional fees, non-recurring bonuses, and other costs related to the merger with Landcadia III and the secondary offering of shares in 2022. 4. Infrequent buy backs associated with new business wins. 5. Anti-dumping duties assessed related to the nail business for prior year purchases. 6. The warrant liabilities are marked to market each period end. 7. In connection with the merger,we refinanced our Term Credit Agreement and ABL Revolver. Proceeds from the refinancing were used to redeem in full senior notes due July 15, 2022 (the “6.375% Senior Notes”) and the 11.6% Junior Subordinated Debentures 8. In the third quarter of 2021, we recorded an inventory valuation adjustment in our Hardware and Protective Solutions segment of $32.0 million primarily related to strategic review of our COVID-19 related product offerings. We evaluated our customers' needs and the market conditions and ultimately decided to exit the following protective product categories related to COVID-19; cleaning wipes, disinfecting sprays, face masks, and certain disposable gloves. Adjusted EBITDA Reconciliation
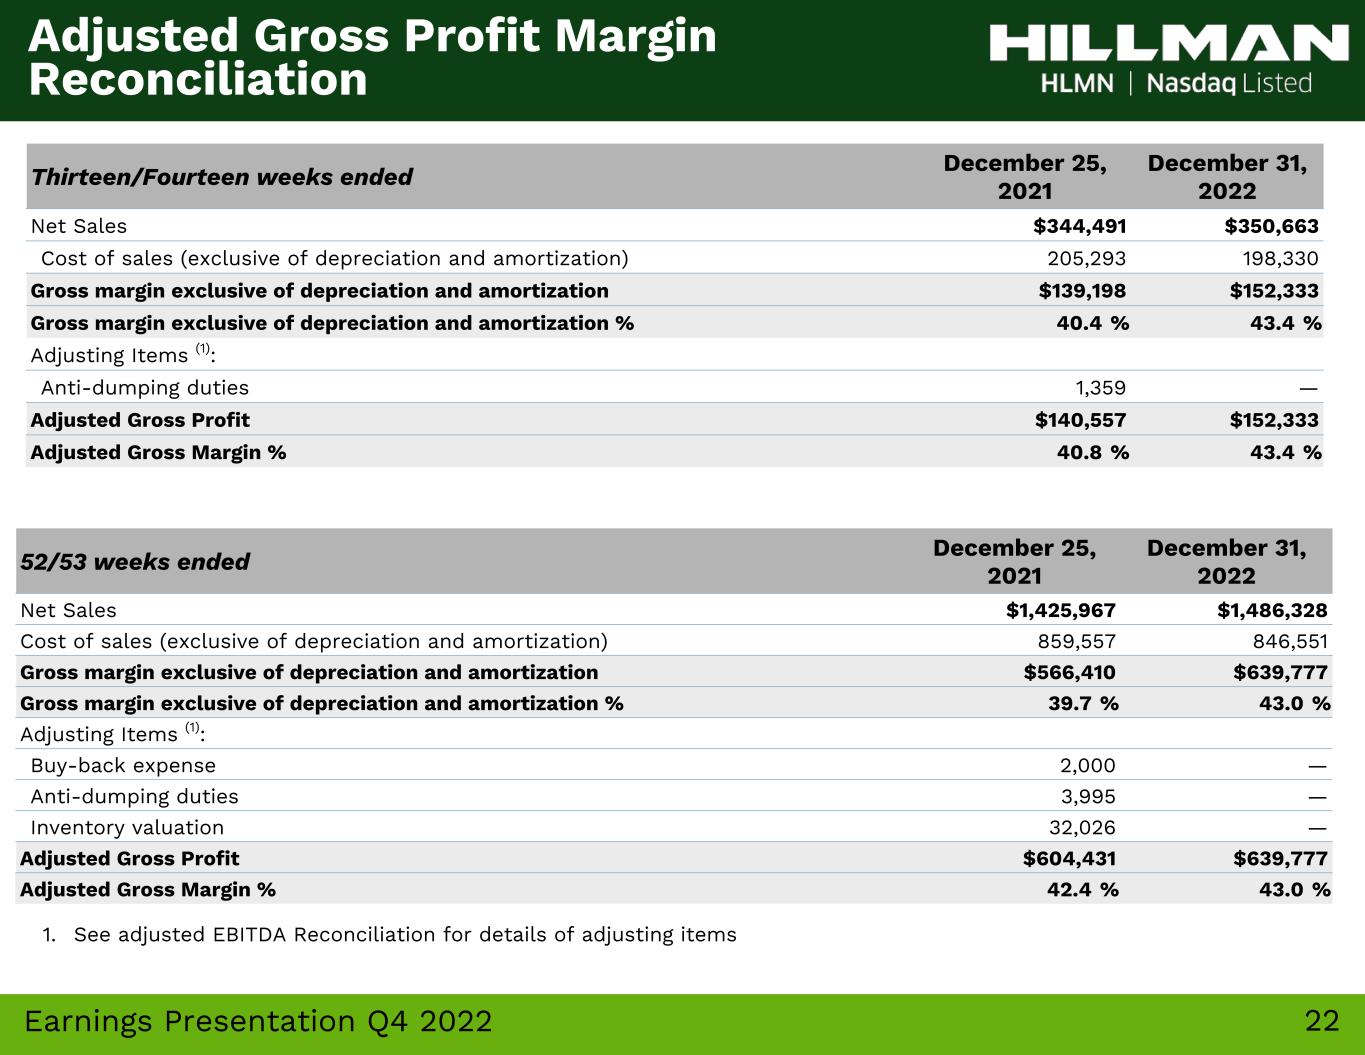
22Earnings Presentation Q4 2022 Thirteen/Fourteen weeks ended December 25, 2021 December 31, 2022 Net Sales $344,491 $350,663 Cost of sales (exclusive of depreciation and amortization) 205,293 198,330 Gross margin exclusive of depreciation and amortization $139,198 $152,333 Gross margin exclusive of depreciation and amortization % 40.4 % 43.4 % Adjusting Items (1): Anti-dumping duties 1,359 — Adjusted Gross Profit $140,557 $152,333 Adjusted Gross Margin % 40.8 % 43.4 % Adjusted Gross Profit Margin Reconciliation 1. See adjusted EBITDA Reconciliation for details of adjusting items 52/53 weeks ended December 25, 2021 December 31, 2022 Net Sales $1,425,967 $1,486,328 Cost of sales (exclusive of depreciation and amortization) 859,557 846,551 Gross margin exclusive of depreciation and amortization $566,410 $639,777 Gross margin exclusive of depreciation and amortization % 39.7 % 43.0 % Adjusting Items (1): Buy-back expense 2,000 — Anti-dumping duties 3,995 — Inventory valuation 32,026 — Adjusted Gross Profit $604,431 $639,777 Adjusted Gross Margin % 42.4 % 43.0 %
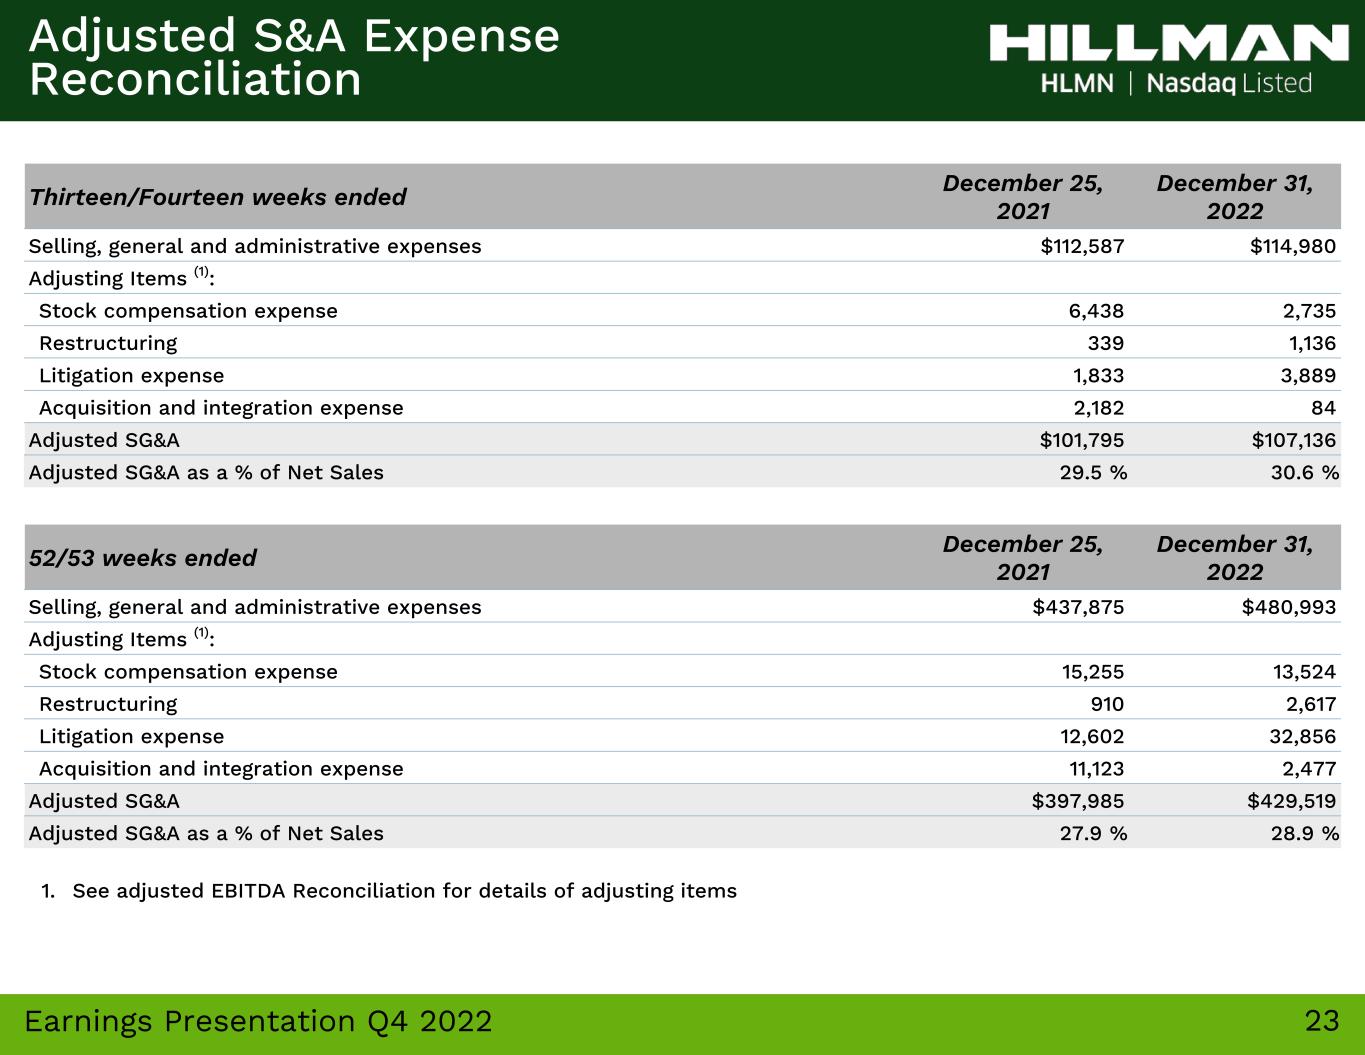
23Earnings Presentation Q4 2022 Thirteen/Fourteen weeks ended December 25, 2021 December 31, 2022 Selling, general and administrative expenses $112,587 $114,980 Adjusting Items (1): Stock compensation expense 6,438 2,735 Restructuring 339 1,136 Litigation expense 1,833 3,889 Acquisition and integration expense 2,182 84 Adjusted SG&A $101,795 $107,136 Adjusted SG&A as a % of Net Sales 29.5 % 30.6 % Adjusted S&A Expense Reconciliation 1. See adjusted EBITDA Reconciliation for details of adjusting items 52/53 weeks ended December 25, 2021 December 31, 2022 Selling, general and administrative expenses $437,875 $480,993 Adjusting Items (1): Stock compensation expense 15,255 13,524 Restructuring 910 2,617 Litigation expense 12,602 32,856 Acquisition and integration expense 11,123 2,477 Adjusted SG&A $397,985 $429,519 Adjusted SG&A as a % of Net Sales 27.9 % 28.9 %
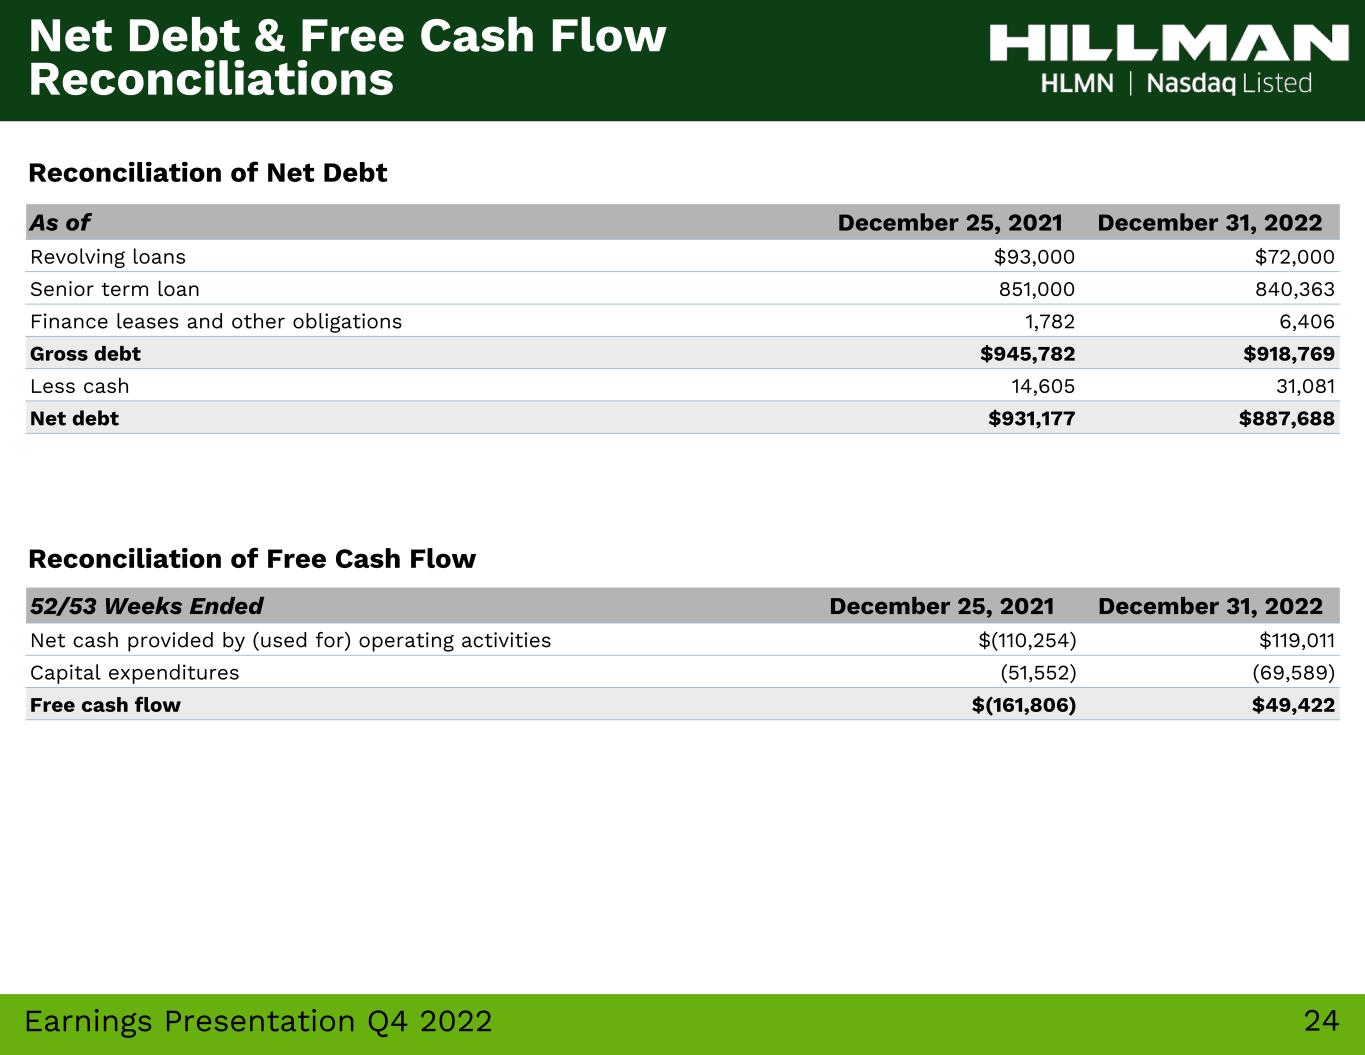
24Earnings Presentation Q4 2022 As of December 25, 2021 December 31, 2022 Revolving loans $93,000 $72,000 Senior term loan 851,000 840,363 Finance leases and other obligations 1,782 6,406 Gross debt $945,782 $918,769 Less cash 14,605 31,081 Net debt $931,177 $887,688 Net Debt & Free Cash Flow Reconciliations 52/53 Weeks Ended December 25, 2021 December 31, 2022 Net cash provided by (used for) operating activities $(110,254) $119,011 Capital expenditures (51,552) (69,589) Free cash flow $(161,806) $49,422 Reconciliation of Net Debt Reconciliation of Free Cash Flow
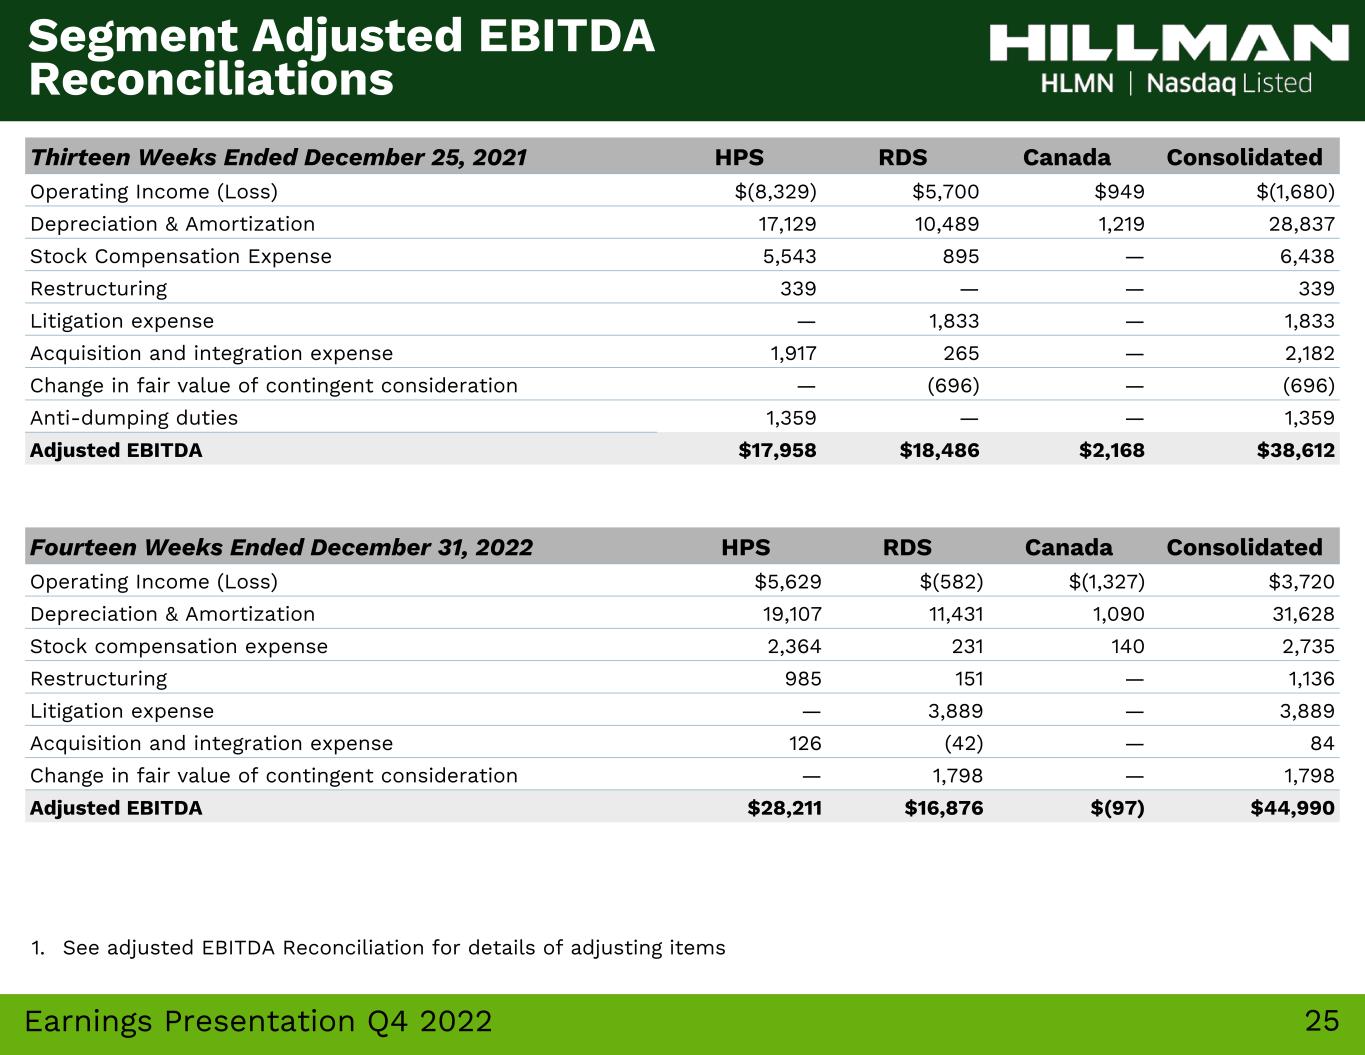
25Earnings Presentation Q4 2022 Fourteen Weeks Ended December 31, 2022 HPS RDS Canada Consolidated Operating Income (Loss) $5,629 $(582) $(1,327) $3,720 Depreciation & Amortization 19,107 11,431 1,090 31,628 Stock compensation expense 2,364 231 140 2,735 Restructuring 985 151 — 1,136 Litigation expense — 3,889 — 3,889 Acquisition and integration expense 126 (42) — 84 Change in fair value of contingent consideration — 1,798 — 1,798 Adjusted EBITDA $28,211 $16,876 $(97) $44,990 Thirteen Weeks Ended December 25, 2021 HPS RDS Canada Consolidated Operating Income (Loss) $(8,329) $5,700 $949 $(1,680) Depreciation & Amortization 17,129 10,489 1,219 28,837 Stock Compensation Expense 5,543 895 — 6,438 Restructuring 339 — — 339 Litigation expense — 1,833 — 1,833 Acquisition and integration expense 1,917 265 — 2,182 Change in fair value of contingent consideration — (696) — (696) Anti-dumping duties 1,359 — — 1,359 Adjusted EBITDA $17,958 $18,486 $2,168 $38,612 Segment Adjusted EBITDA Reconciliations 1. See adjusted EBITDA Reconciliation for details of adjusting items
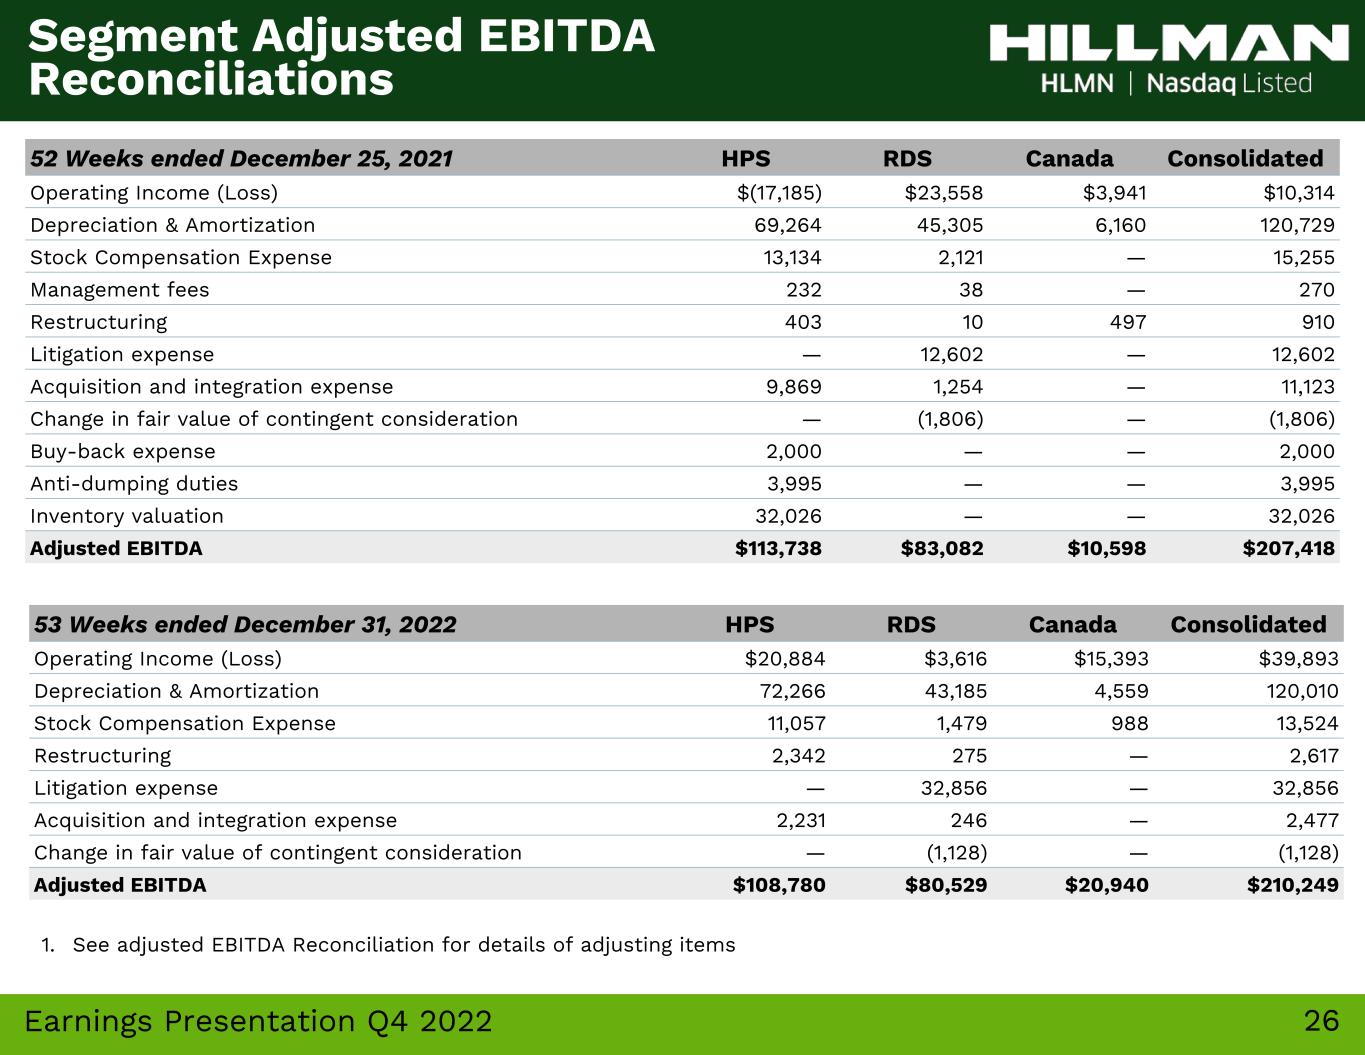
26Earnings Presentation Q4 2022 53 Weeks ended December 31, 2022 HPS RDS Canada Consolidated Operating Income (Loss) $20,884 $3,616 $15,393 $39,893 Depreciation & Amortization 72,266 43,185 4,559 120,010 Stock Compensation Expense 11,057 1,479 988 13,524 Restructuring 2,342 275 — 2,617 Litigation expense — 32,856 — 32,856 Acquisition and integration expense 2,231 246 — 2,477 Change in fair value of contingent consideration — (1,128) — (1,128) Adjusted EBITDA $108,780 $80,529 $20,940 $210,249 52 Weeks ended December 25, 2021 HPS RDS Canada Consolidated Operating Income (Loss) $(17,185) $23,558 $3,941 $10,314 Depreciation & Amortization 69,264 45,305 6,160 120,729 Stock Compensation Expense 13,134 2,121 — 15,255 Management fees 232 38 — 270 Restructuring 403 10 497 910 Litigation expense — 12,602 — 12,602 Acquisition and integration expense 9,869 1,254 — 11,123 Change in fair value of contingent consideration — (1,806) — (1,806) Buy-back expense 2,000 — — 2,000 Anti-dumping duties 3,995 — — 3,995 Inventory valuation 32,026 — — 32,026 Adjusted EBITDA $113,738 $83,082 $10,598 $207,418 Segment Adjusted EBITDA Reconciliations 1. See adjusted EBITDA Reconciliation for details of adjusting items