EX-99.2
Published on February 18, 2025

Quarterly Earnings Results Presentation Q4 2024 (February 2025)
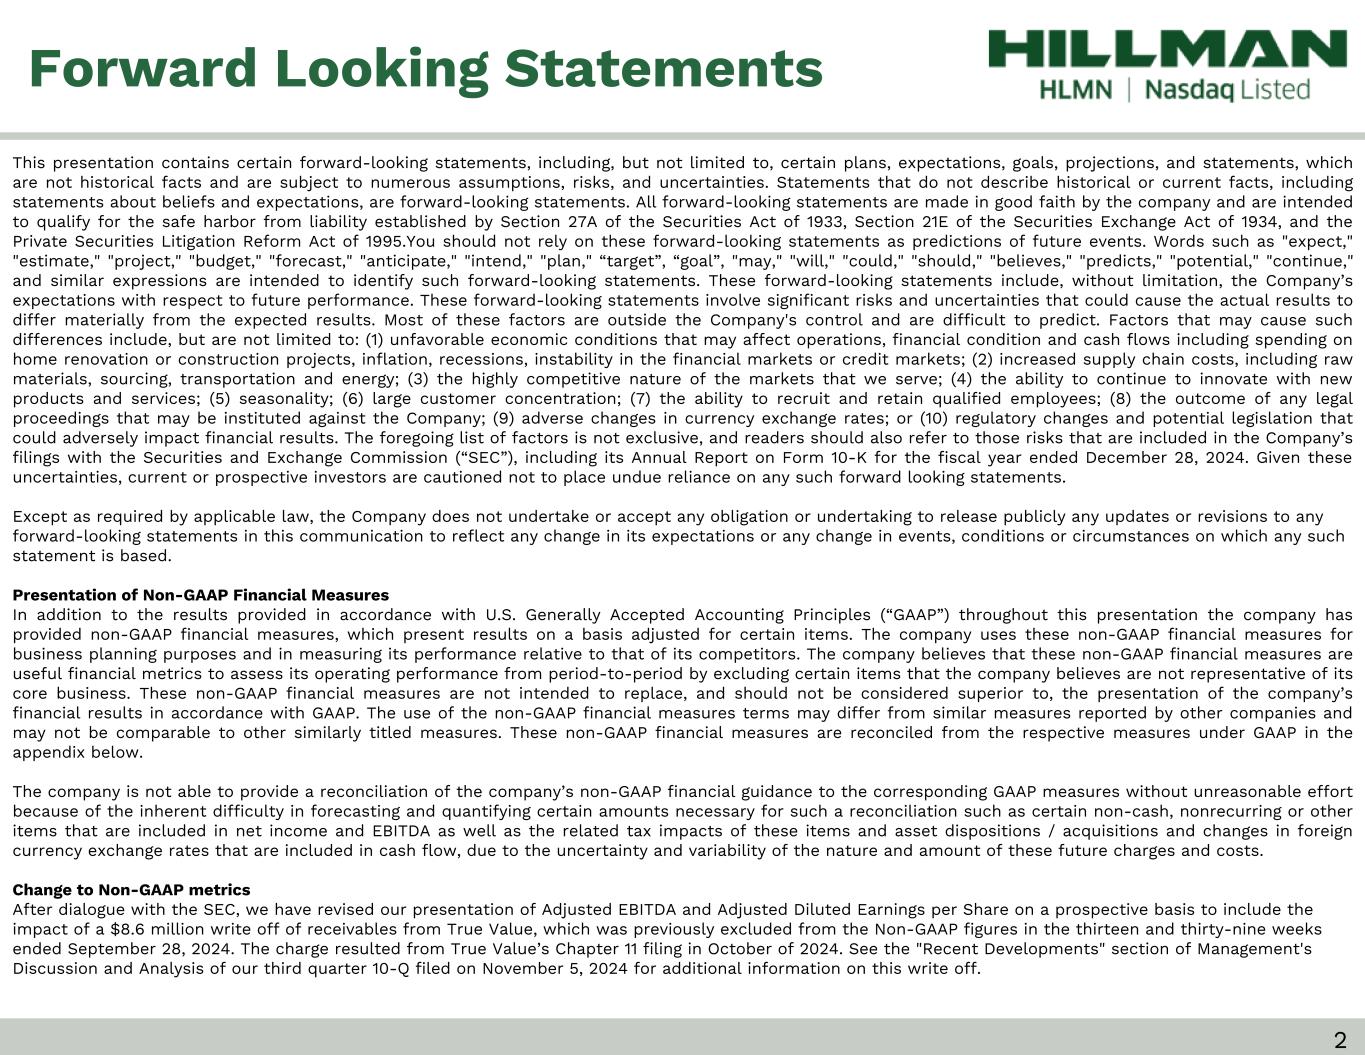
PresBuilder Placeholder - Delete this box if you see it on a slide, but DO NOT REMOVE this box from the slide layout This presentation contains certain forward-looking statements, including, but not limited to, certain plans, expectations, goals, projections, and statements, which are not historical facts and are subject to numerous assumptions, risks, and uncertainties. Statements that do not describe historical or current facts, including statements about beliefs and expectations, are forward-looking statements. All forward-looking statements are made in good faith by the company and are intended to qualify for the safe harbor from liability established by Section 27A of the Securities Act of 1933, Section 21E of the Securities Exchange Act of 1934, and the Private Securities Litigation Reform Act of 1995.You should not rely on these forward-looking statements as predictions of future events. Words such as "expect," "estimate," "project," "budget," "forecast," "anticipate," "intend," "plan," “target”, “goal”, "may," "will," "could," "should," "believes," "predicts," "potential," "continue," and similar expressions are intended to identify such forward-looking statements. These forward-looking statements include, without limitation, the Company’s expectations with respect to future performance. These forward-looking statements involve significant risks and uncertainties that could cause the actual results to differ materially from the expected results. Most of these factors are outside the Company's control and are difficult to predict. Factors that may cause such differences include, but are not limited to: (1) unfavorable economic conditions that may affect operations, financial condition and cash flows including spending on home renovation or construction projects, inflation, recessions, instability in the financial markets or credit markets; (2) increased supply chain costs, including raw materials, sourcing, transportation and energy; (3) the highly competitive nature of the markets that we serve; (4) the ability to continue to innovate with new products and services; (5) seasonality; (6) large customer concentration; (7) the ability to recruit and retain qualified employees; (8) the outcome of any legal proceedings that may be instituted against the Company; (9) adverse changes in currency exchange rates; or (10) regulatory changes and potential legislation that could adversely impact financial results. The foregoing list of factors is not exclusive, and readers should also refer to those risks that are included in the Company’s filings with the Securities and Exchange Commission (“SEC”), including its Annual Report on Form 10-K for the fiscal year ended December 28, 2024. Given these uncertainties, current or prospective investors are cautioned not to place undue reliance on any such forward looking statements. Except as required by applicable law, the Company does not undertake or accept any obligation or undertaking to release publicly any updates or revisions to any forward-looking statements in this communication to reflect any change in its expectations or any change in events, conditions or circumstances on which any such statement is based. Presentation of Non-GAAP Financial Measures In addition to the results provided in accordance with U.S. Generally Accepted Accounting Principles (“GAAP”) throughout this presentation the company has provided non-GAAP financial measures, which present results on a basis adjusted for certain items. The company uses these non-GAAP financial measures for business planning purposes and in measuring its performance relative to that of its competitors. The company believes that these non-GAAP financial measures are useful financial metrics to assess its operating performance from period-to-period by excluding certain items that the company believes are not representative of its core business. These non-GAAP financial measures are not intended to replace, and should not be considered superior to, the presentation of the company’s financial results in accordance with GAAP. The use of the non-GAAP financial measures terms may differ from similar measures reported by other companies and may not be comparable to other similarly titled measures. These non-GAAP financial measures are reconciled from the respective measures under GAAP in the appendix below. The company is not able to provide a reconciliation of the company’s non-GAAP financial guidance to the corresponding GAAP measures without unreasonable effort because of the inherent difficulty in forecasting and quantifying certain amounts necessary for such a reconciliation such as certain non-cash, nonrecurring or other items that are included in net income and EBITDA as well as the related tax impacts of these items and asset dispositions / acquisitions and changes in foreign currency exchange rates that are included in cash flow, due to the uncertainty and variability of the nature and amount of these future charges and costs. Change to Non-GAAP metrics After dialogue with the SEC, we have revised our presentation of Adjusted EBITDA and Adjusted Diluted Earnings per Share on a prospective basis to include the impact of a $8.6 million write off of receivables from True Value, which was previously excluded from the Non-GAAP figures in the thirteen and thirty-nine weeks ended September 28, 2024. The charge resulted from True Value’s Chapter 11 filing in October of 2024. See the "Recent Developments" section of Management's Discussion and Analysis of our third quarter 10-Q filed on November 5, 2024 for additional information on this write off. Forward Looking Statements 2
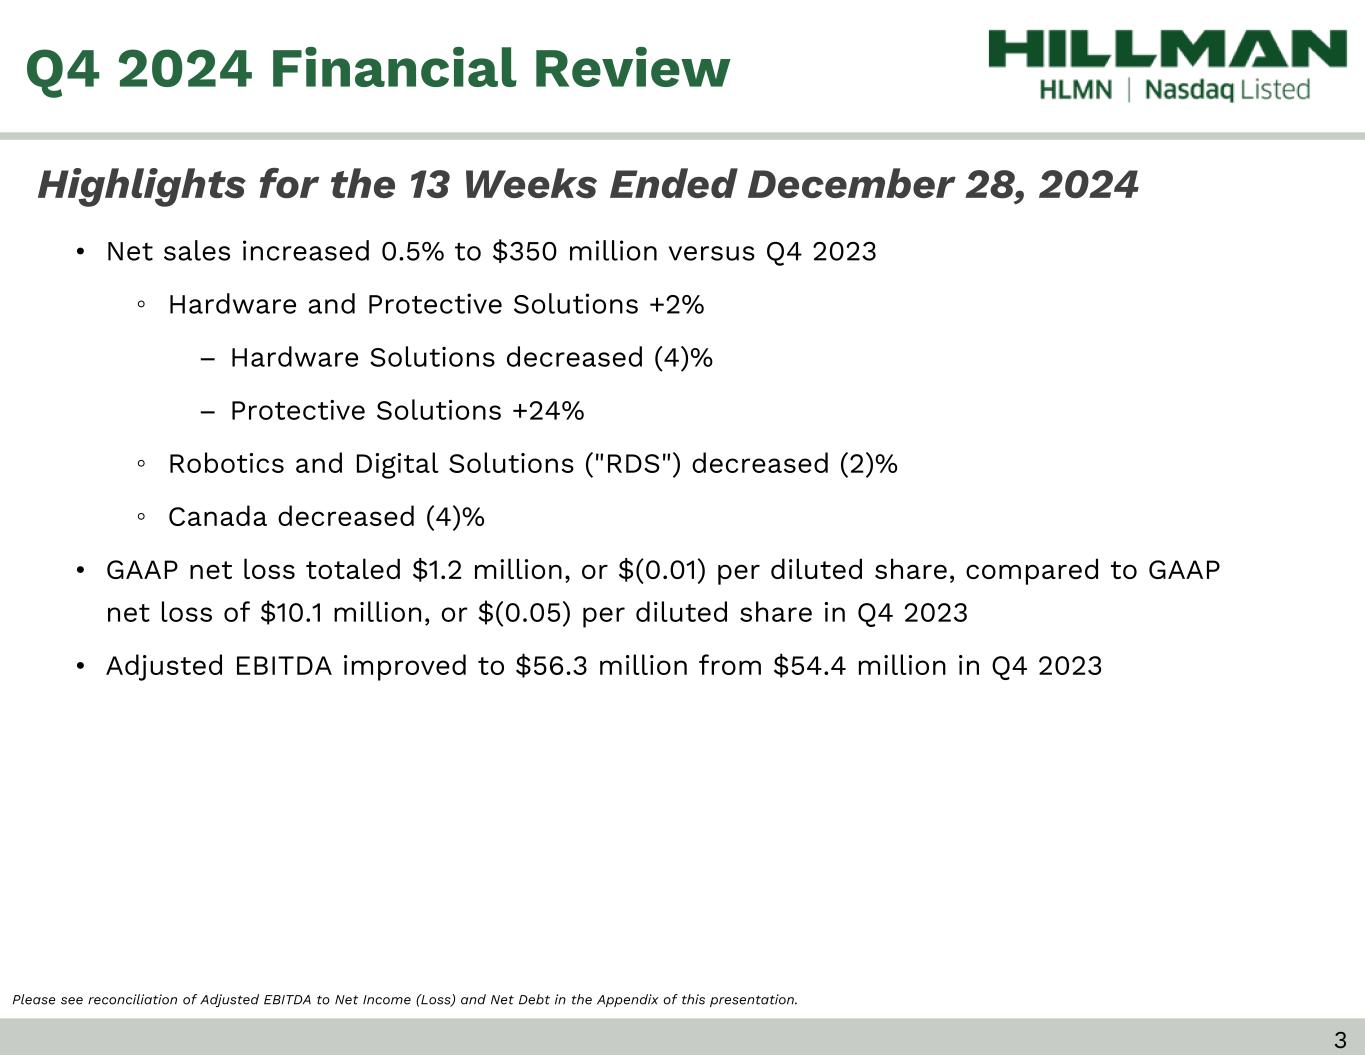
• Net sales increased 0.5% to $350 million versus Q4 2023 ◦ Hardware and Protective Solutions +2% – Hardware Solutions decreased (4)% – Protective Solutions +24% ◦ Robotics and Digital Solutions ("RDS") decreased (2)% ◦ Canada decreased (4)% • GAAP net loss totaled $1.2 million, or $(0.01) per diluted share, compared to GAAP net loss of $10.1 million, or $(0.05) per diluted share in Q4 2023 • Adjusted EBITDA improved to $56.3 million from $54.4 million in Q4 2023 Q4 2024 Financial Review Please see reconciliation of Adjusted EBITDA to Net Income (Loss) and Net Debt in the Appendix of this presentation. Highlights for the 13 Weeks Ended December 28, 2024 3
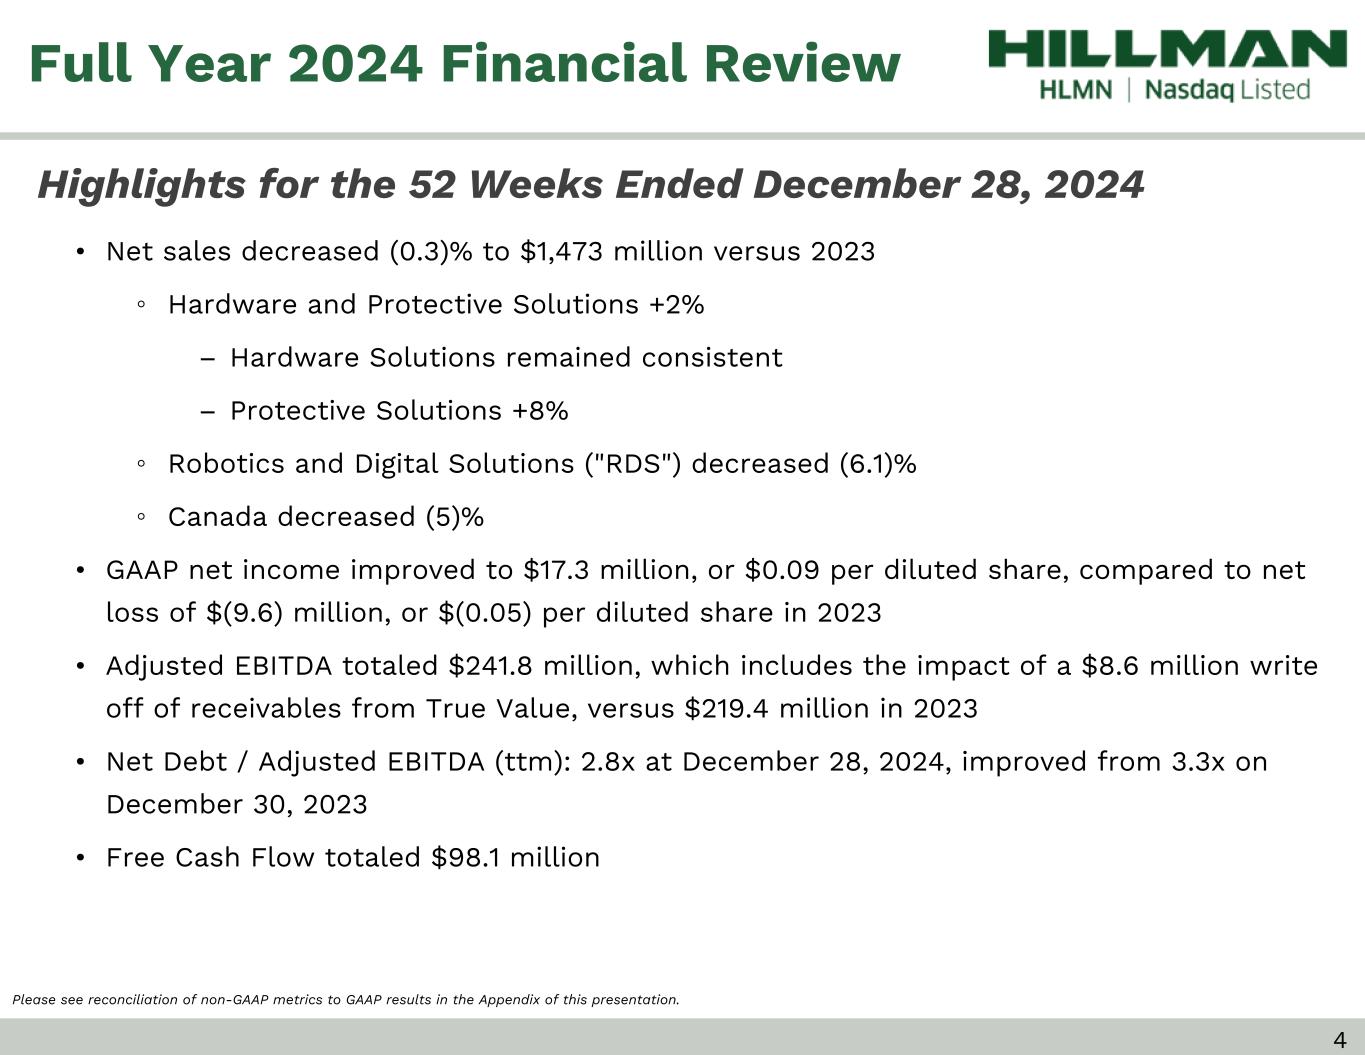
Full Year 2024 Financial Review 4 Highlights for the 52 Weeks Ended December 28, 2024 • Net sales decreased (0.3)% to $1,473 million versus 2023 ◦ Hardware and Protective Solutions +2% – Hardware Solutions remained consistent – Protective Solutions +8% ◦ Robotics and Digital Solutions ("RDS") decreased (6.1)% ◦ Canada decreased (5)% • GAAP net income improved to $17.3 million, or $0.09 per diluted share, compared to net loss of $(9.6) million, or $(0.05) per diluted share in 2023 • Adjusted EBITDA totaled $241.8 million, which includes the impact of a $8.6 million write off of receivables from True Value, versus $219.4 million in 2023 • Net Debt / Adjusted EBITDA (ttm): 2.8x at December 28, 2024, improved from 3.3x on December 30, 2023 • Free Cash Flow totaled $98.1 million Please see reconciliation of non-GAAP metrics to GAAP results in the Appendix of this presentation.
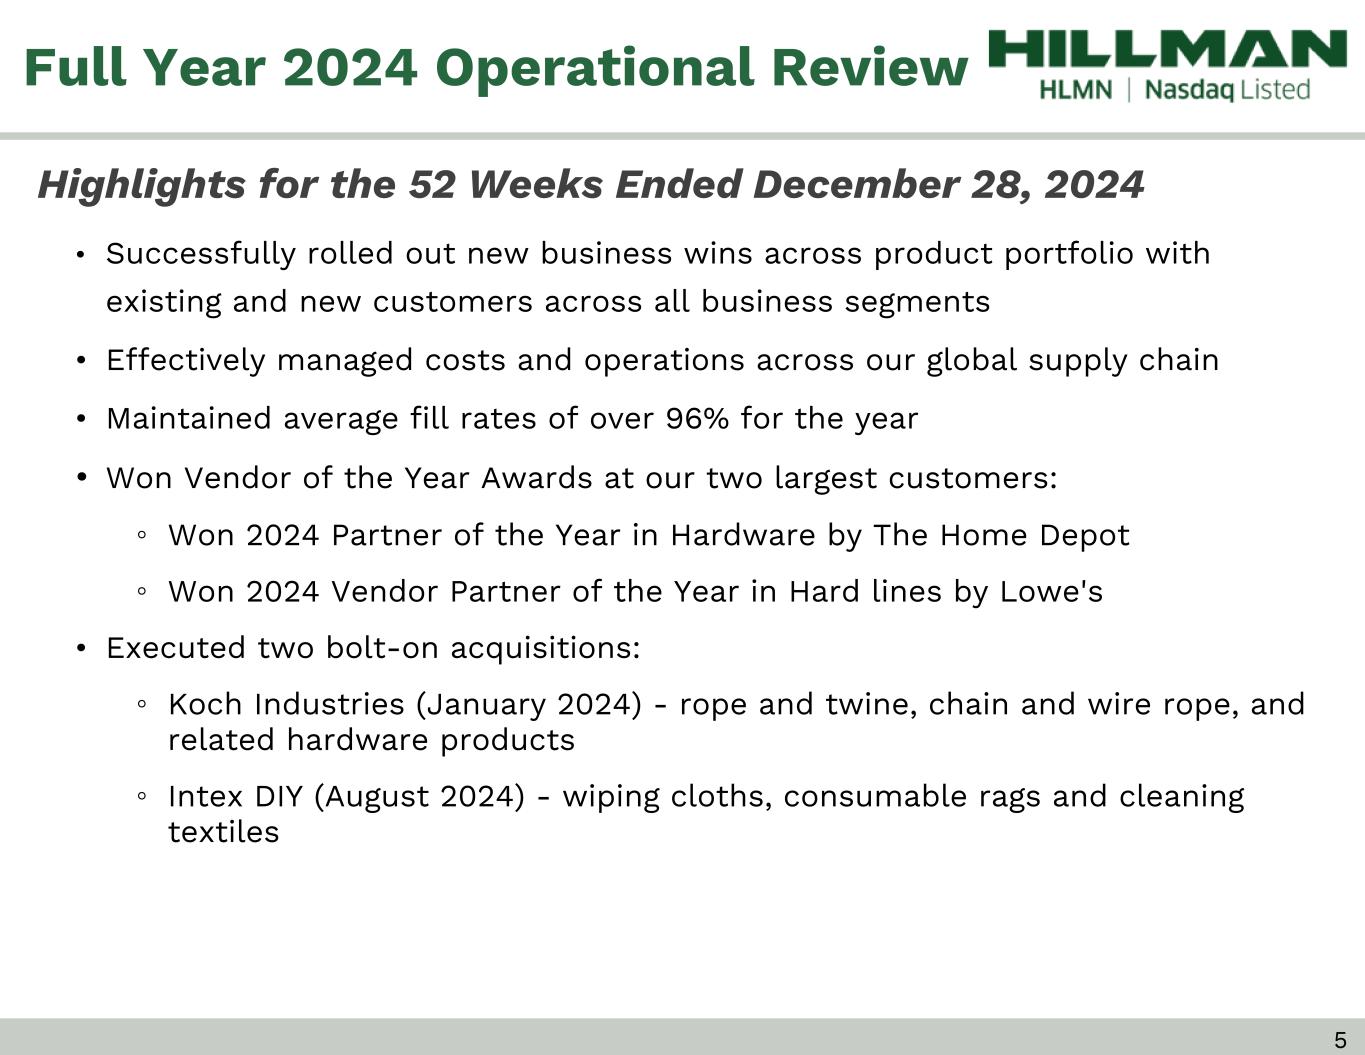
Full Year 2024 Operational Review 5 Highlights for the 52 Weeks Ended December 28, 2024 • Successfully rolled out new business wins across product portfolio with existing and new customers across all business segments • Effectively managed costs and operations across our global supply chain • Maintained average fill rates of over 96% for the year • Won Vendor of the Year Awards at our two largest customers: ◦ Won 2024 Partner of the Year in Hardware by The Home Depot ◦ Won 2024 Vendor Partner of the Year in Hard lines by Lowe's • Executed two bolt-on acquisitions: ◦ Koch Industries (January 2024) - rope and twine, chain and wire rope, and related hardware products ◦ Intex DIY (August 2024) - wiping cloths, consumable rags and cleaning textiles
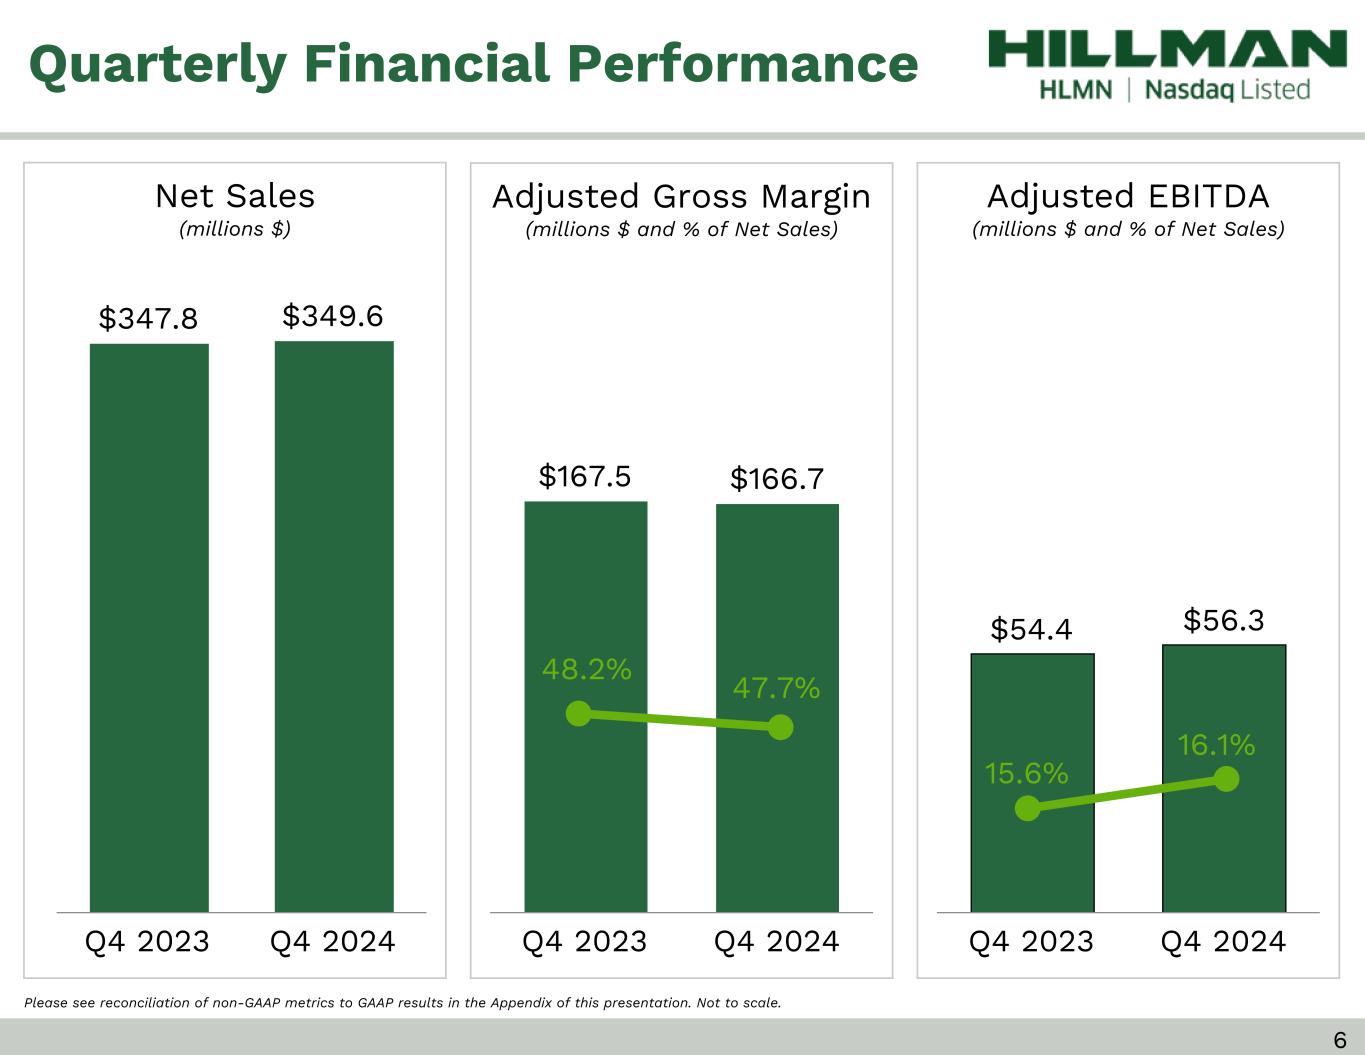
$167.5 $166.7 Q4 2023 Q4 2024 Adjusted EBITDA (millions $ and % of Net Sales) Please see reconciliation of non-GAAP metrics to GAAP results in the Appendix of this presentation. Not to scale. Net Sales (millions $) Adjusted Gross Margin (millions $ and % of Net Sales) Quarterly Financial Performance $54.4 $56.3 Q4 2023 Q4 2024 16.1% 15.6% $347.8 $349.6 Q4 2023 Q4 2024 47.7%48.2% 6
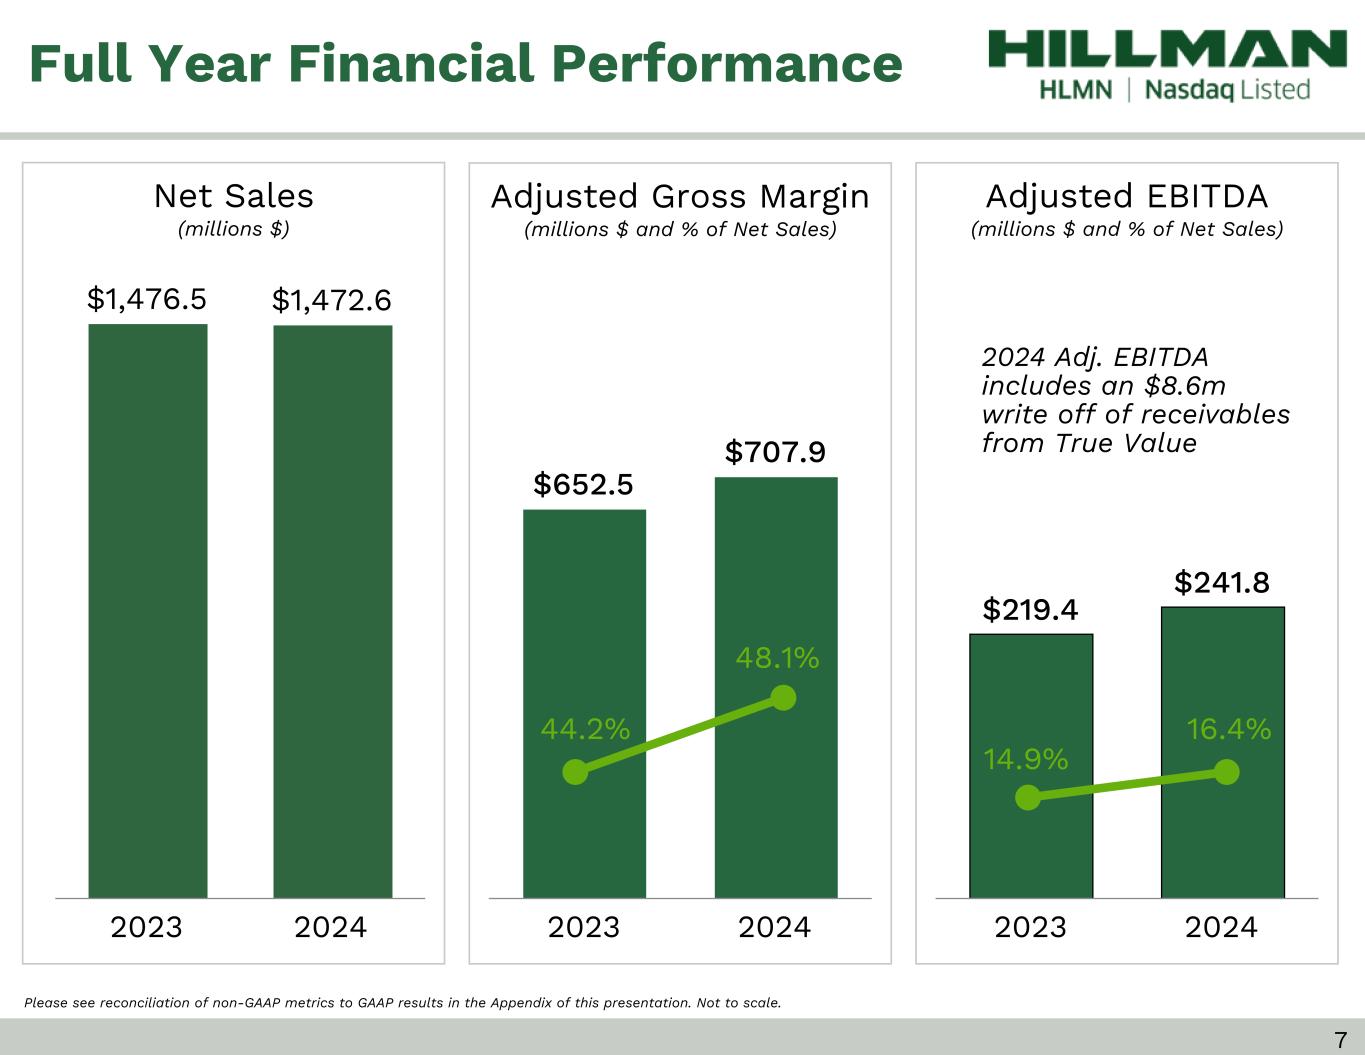
Adjusted EBITDA (millions $ and % of Net Sales) Net Sales (millions $) Adjusted Gross Margin (millions $ and % of Net Sales) $219.4 $241.8 2023 2024 16.4% 14.9% $652.5 $707.9 2023 2024 $1,476.5 $1,472.6 2023 2024 48.1% 44.2% 7 Please see reconciliation of non-GAAP metrics to GAAP results in the Appendix of this presentation. Not to scale. Full Year Financial Performance 2024 Adj. EBITDA includes an $8.6m write off of receivables from True Value
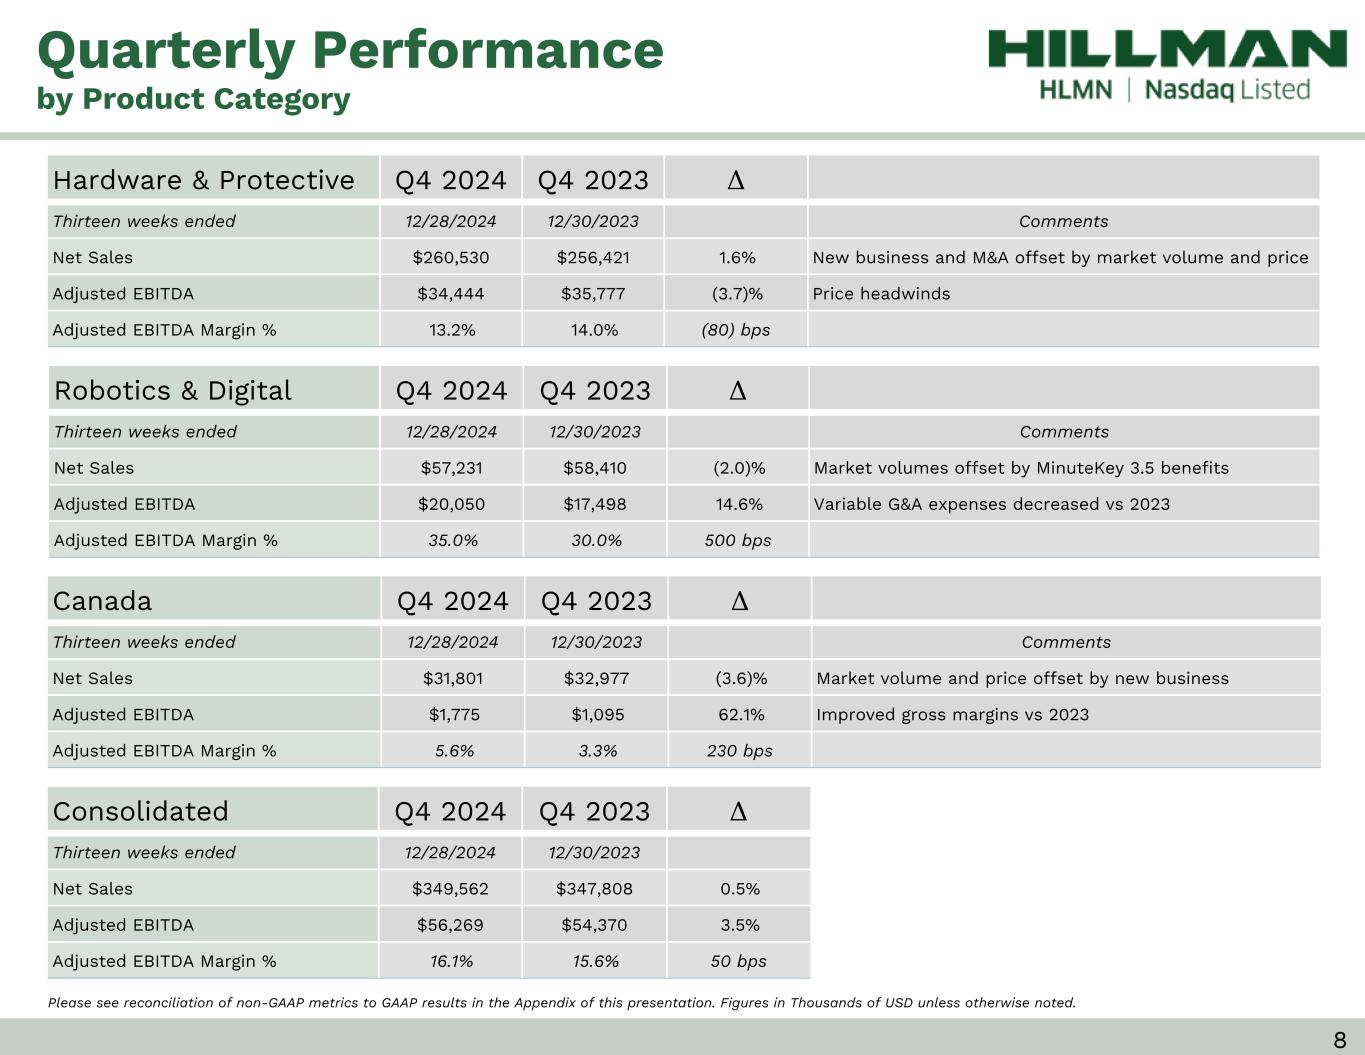
Hardware & Protective Q4 2024 Q4 2023 Δ Thirteen weeks ended 12/28/2024 12/30/2023 Comments Net Sales $260,530 $256,421 1.6% New business and M&A offset by market volume and price Adjusted EBITDA $34,444 $35,777 (3.7)% Price headwinds Adjusted EBITDA Margin % 13.2% 14.0% (80) bps Robotics & Digital Q4 2024 Q4 2023 Δ Thirteen weeks ended 12/28/2024 12/30/2023 Comments Net Sales $57,231 $58,410 (2.0)% Market volumes offset by MinuteKey 3.5 benefits Adjusted EBITDA $20,050 $17,498 14.6% Variable G&A expenses decreased vs 2023 Adjusted EBITDA Margin % 35.0% 30.0% 500 bps Canada Q4 2024 Q4 2023 Δ Thirteen weeks ended 12/28/2024 12/30/2023 Comments Net Sales $31,801 $32,977 (3.6)% Market volume and price offset by new business Adjusted EBITDA $1,775 $1,095 62.1% Improved gross margins vs 2023 Adjusted EBITDA Margin % 5.6% 3.3% 230 bps Consolidated Q4 2024 Q4 2023 Δ Thirteen weeks ended 12/28/2024 12/30/2023 Net Sales $349,562 $347,808 0.5% Adjusted EBITDA $56,269 $54,370 3.5% Adjusted EBITDA Margin % 16.1% 15.6% 50 bps Quarterly Performance by Product Category Please see reconciliation of non-GAAP metrics to GAAP results in the Appendix of this presentation. Figures in Thousands of USD unless otherwise noted. 8 • Top Row: ◦ 27 point height ◦ 16 font (work sans) ◦ 4 point white bottom line • First Column green ◦ Dark: CFD9D1 ◦ Light: D9E1DA • Other Columns gray ◦ Dark: D9D9D9 ◦ Light E0E0E0 ◦ 1 point white bottom and inside lines
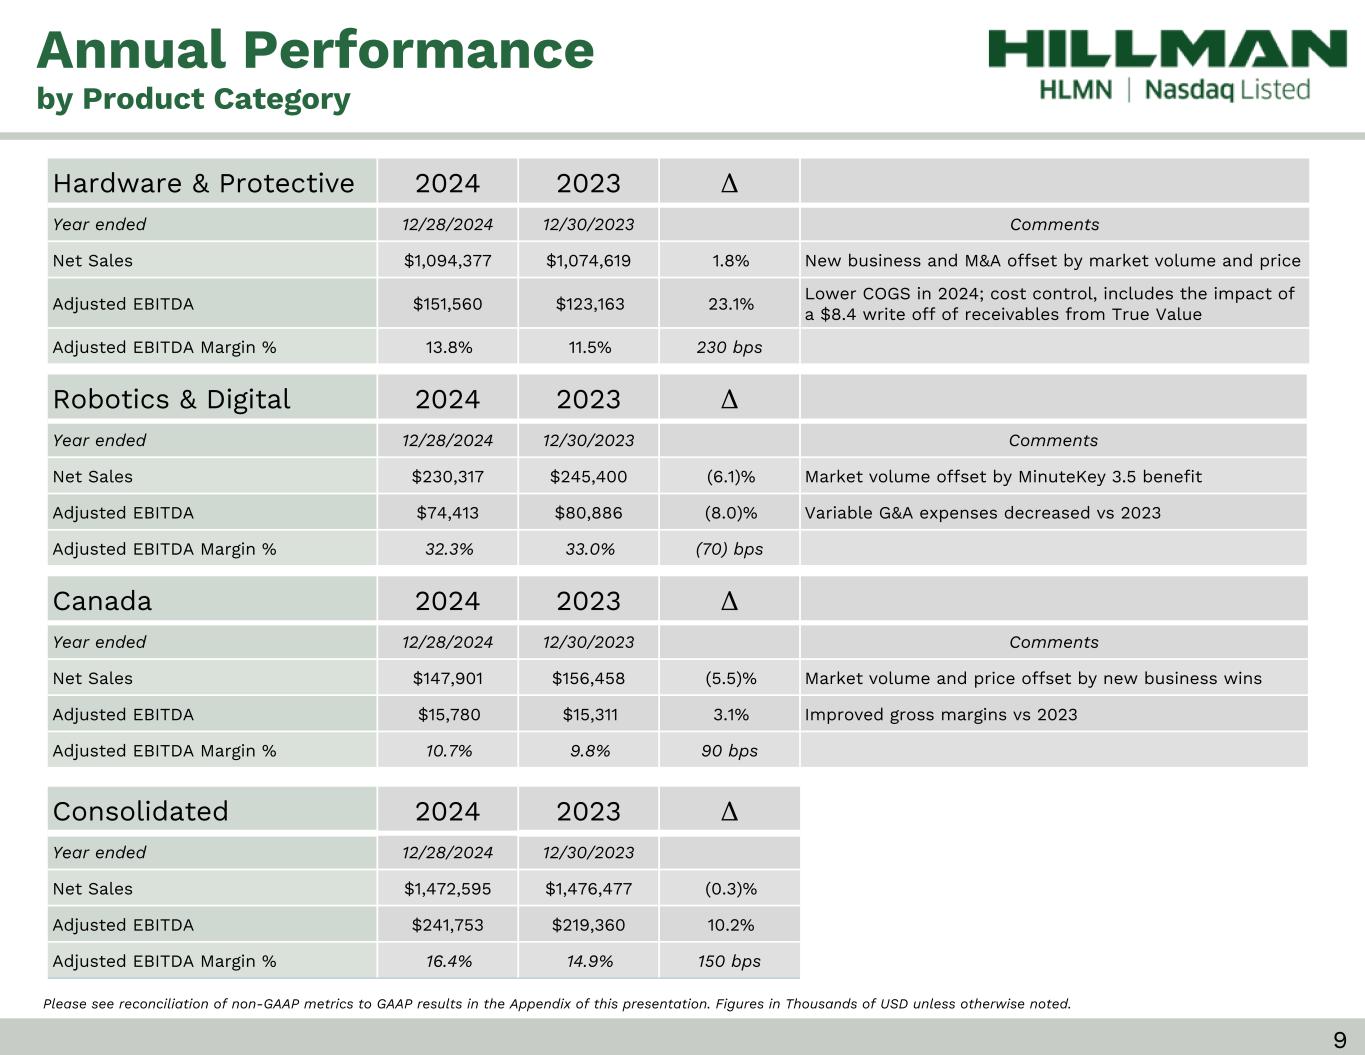
Please see reconciliation of non-GAAP metrics to GAAP results in the Appendix of this presentation. Figures in Thousands of USD unless otherwise noted. 9 Hardware & Protective 2024 2023 Δ Year ended 12/28/2024 12/30/2023 Comments Net Sales $1,094,377 $1,074,619 1.8% New business and M&A offset by market volume and price Adjusted EBITDA $151,560 $123,163 23.1% Lower COGS in 2024; cost control, includes the impact of a $8.4 write off of receivables from True Value Adjusted EBITDA Margin % 13.8% 11.5% 230 bps Robotics & Digital 2024 2023 Δ Year ended 12/28/2024 12/30/2023 Comments Net Sales $230,317 $245,400 (6.1)% Market volume offset by MinuteKey 3.5 benefit Adjusted EBITDA $74,413 $80,886 (8.0)% Variable G&A expenses decreased vs 2023 Adjusted EBITDA Margin % 32.3% 33.0% (70) bps Canada 2024 2023 Δ Year ended 12/28/2024 12/30/2023 Comments Net Sales $147,901 $156,458 (5.5)% Market volume and price offset by new business wins Adjusted EBITDA $15,780 $15,311 3.1% Improved gross margins vs 2023 Adjusted EBITDA Margin % 10.7% 9.8% 90 bps Annual Performance by Product Category • Top Row: ◦ 27 point height ◦ 16 font (work sans) ◦ 4 point white bottom line • First Column green ◦ Dark: CFD9D1 ◦ Light: D9E1DA • Other Columns gray ◦ Dark: D9D9D9 ◦ Light E0E0E0 ◦ 1 point white bottom and inside lines Consolidated 2024 2023 Δ Year ended 12/28/2024 12/30/2023 Net Sales $1,472,595 $1,476,477 (0.3)% Adjusted EBITDA $241,753 $219,360 10.2% Adjusted EBITDA Margin % 16.4% 14.9% 150 bps
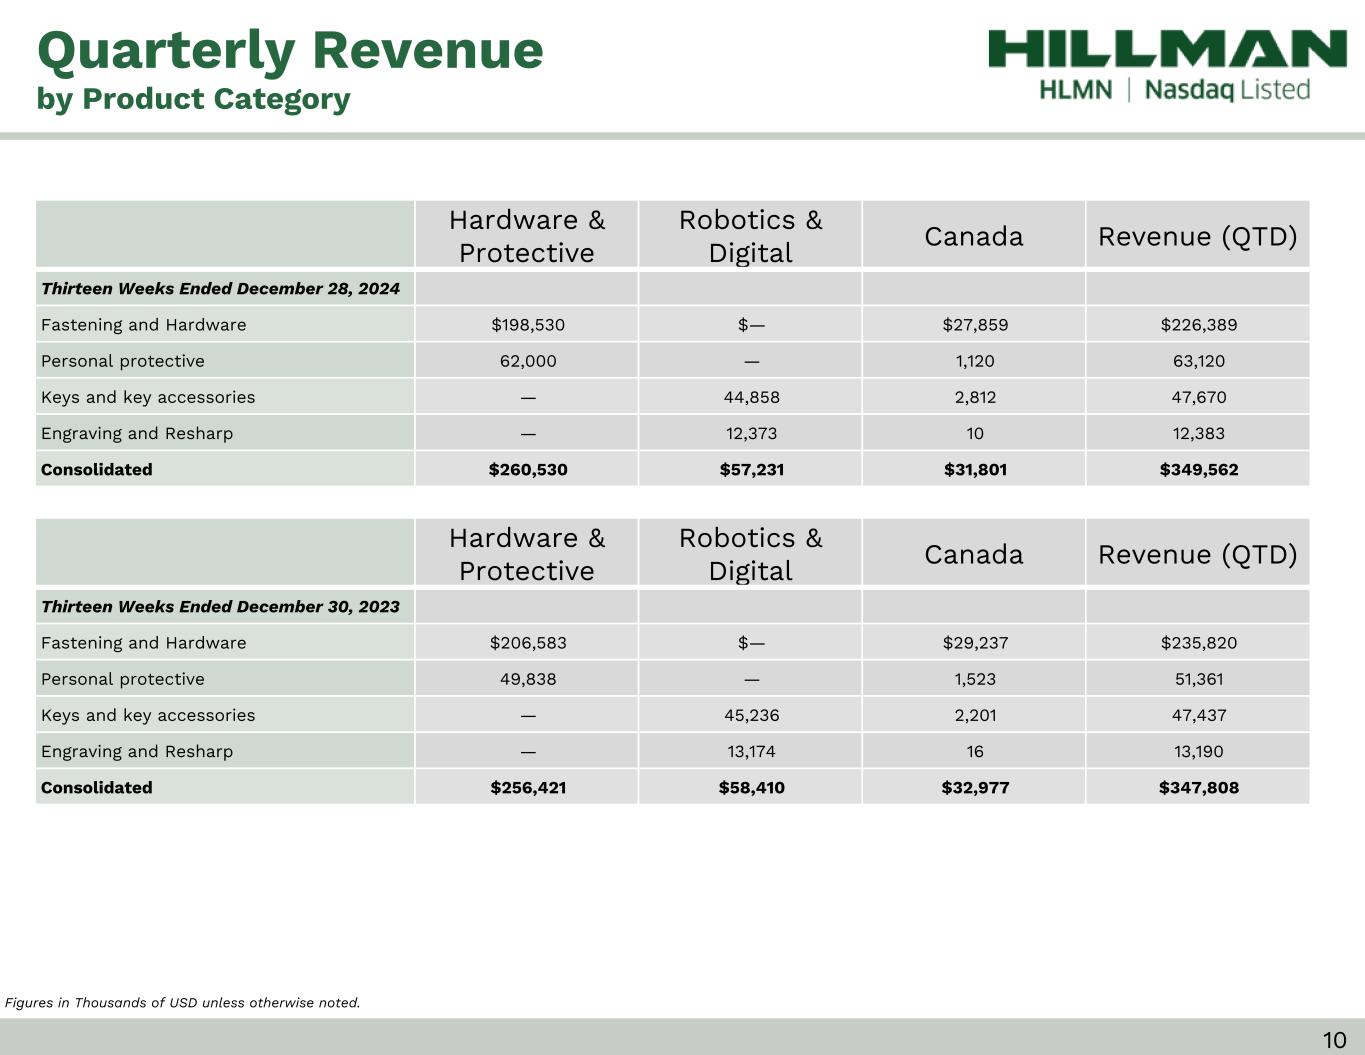
Figures in Thousands of USD unless otherwise noted. Quarterly Revenue by Product Category 10 Hardware & Protective Robotics & Digital Canada Revenue (QTD) Thirteen Weeks Ended December 28, 2024 Fastening and Hardware $198,530 $— $27,859 $226,389 Personal protective 62,000 — 1,120 63,120 Keys and key accessories — 44,858 2,812 47,670 Engraving and Resharp — 12,373 10 12,383 Consolidated $260,530 $57,231 $31,801 $349,562 • Top Row: ◦ 27 point height ◦ 16 font (work sans) ◦ 4 point white bottom line • First Column green ◦ Dark: CFD9D1 ◦ Light: D9E1DA • Other Columns gray ◦ Dark: D9D9D9 ◦ Light E0E0E0 ◦ 1 point white bottom and inside lines Hardware & Protective Robotics & Digital Canada Revenue (QTD) Thirteen Weeks Ended December 30, 2023 Fastening and Hardware $206,583 $— $29,237 $235,820 Personal protective 49,838 — 1,523 51,361 Keys and key accessories — 45,236 2,201 47,437 Engraving and Resharp — 13,174 16 13,190 Consolidated $256,421 $58,410 $32,977 $347,808
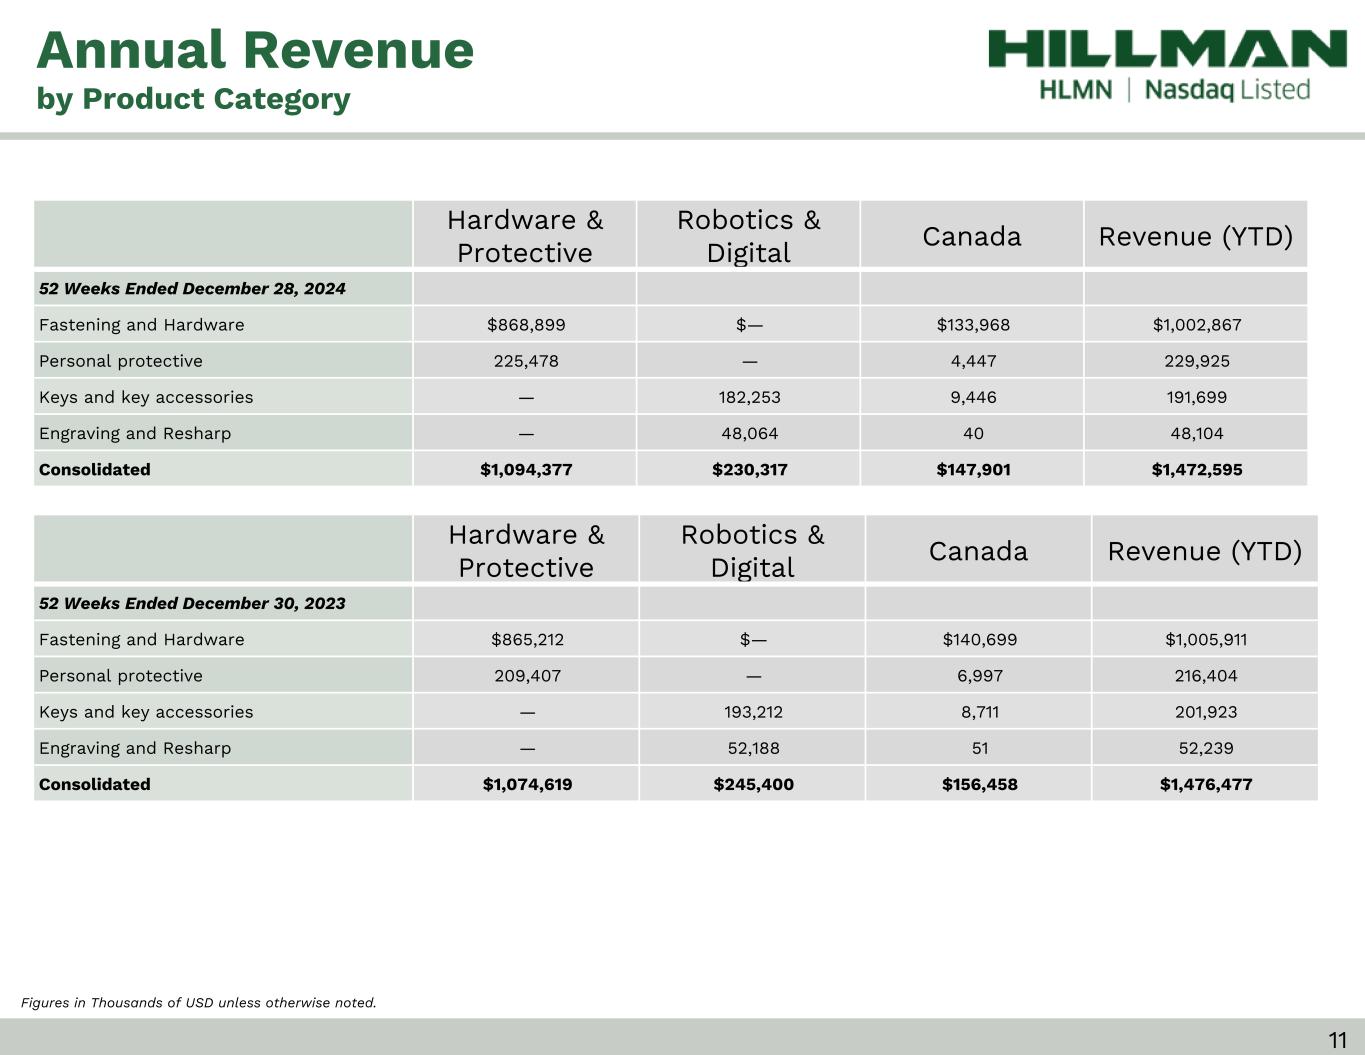
Figures in Thousands of USD unless otherwise noted. Annual Revenue by Product Category 11 Hardware & Protective Robotics & Digital Canada Revenue (YTD) 52 Weeks Ended December 28, 2024 Fastening and Hardware $868,899 $— $133,968 $1,002,867 Personal protective 225,478 — 4,447 229,925 Keys and key accessories — 182,253 9,446 191,699 Engraving and Resharp — 48,064 40 48,104 Consolidated $1,094,377 $230,317 $147,901 $1,472,595 • Top Row: ◦ 27 point height ◦ 16 font (work sans) ◦ 4 point white bottom line • First Column green ◦ Dark: CFD9D1 ◦ Light: D9E1DA • Other Columns gray ◦ Dark: D9D9D9 ◦ Light E0E0E0 ◦ 1 point white bottom and inside lines Hardware & Protective Robotics & Digital Canada Revenue (YTD) 52 Weeks Ended December 30, 2023 Fastening and Hardware $865,212 $— $140,699 $1,005,911 Personal protective 209,407 — 6,997 216,404 Keys and key accessories — 193,212 8,711 201,923 Engraving and Resharp — 52,188 51 52,239 Consolidated $1,074,619 $245,400 $156,458 $1,476,477

Capital Structure Please see reconciliation of non-GAAP metrics to GAAP results in the Appendix of this presentation. Figures in Millions of USD unless otherwise noted, and may not tie due to rounding. 3.3x 3.2x 2.9x 2.9x 2.8x 12 /3 0/ 20 23 3/ 30 /2 02 3 06 /2 9/ 20 24 09 /2 8/ 20 24 12 /2 8/ 20 24 0.0x 0.5x 1.0x 1.5x 2.0x 2.5x 3.0x 3.5x 4.0x December 28, 2024 ABL Revolver ($189 million capacity) $62.0 Term Note $645.5 Finance Leases and other obligations $11.1 Total Debt $718.6 Cash $44.5 Net Debt $674.0 TTM Adjusted EBITDA $241.8 Net Debt / TTM Adjusted EBITDA 2.8x Net Debt reduced by $48.4 million Leverage continues to improve while executing M&A Total Net Leverage (Net Debt / TTM Adj. EBITDA) 12
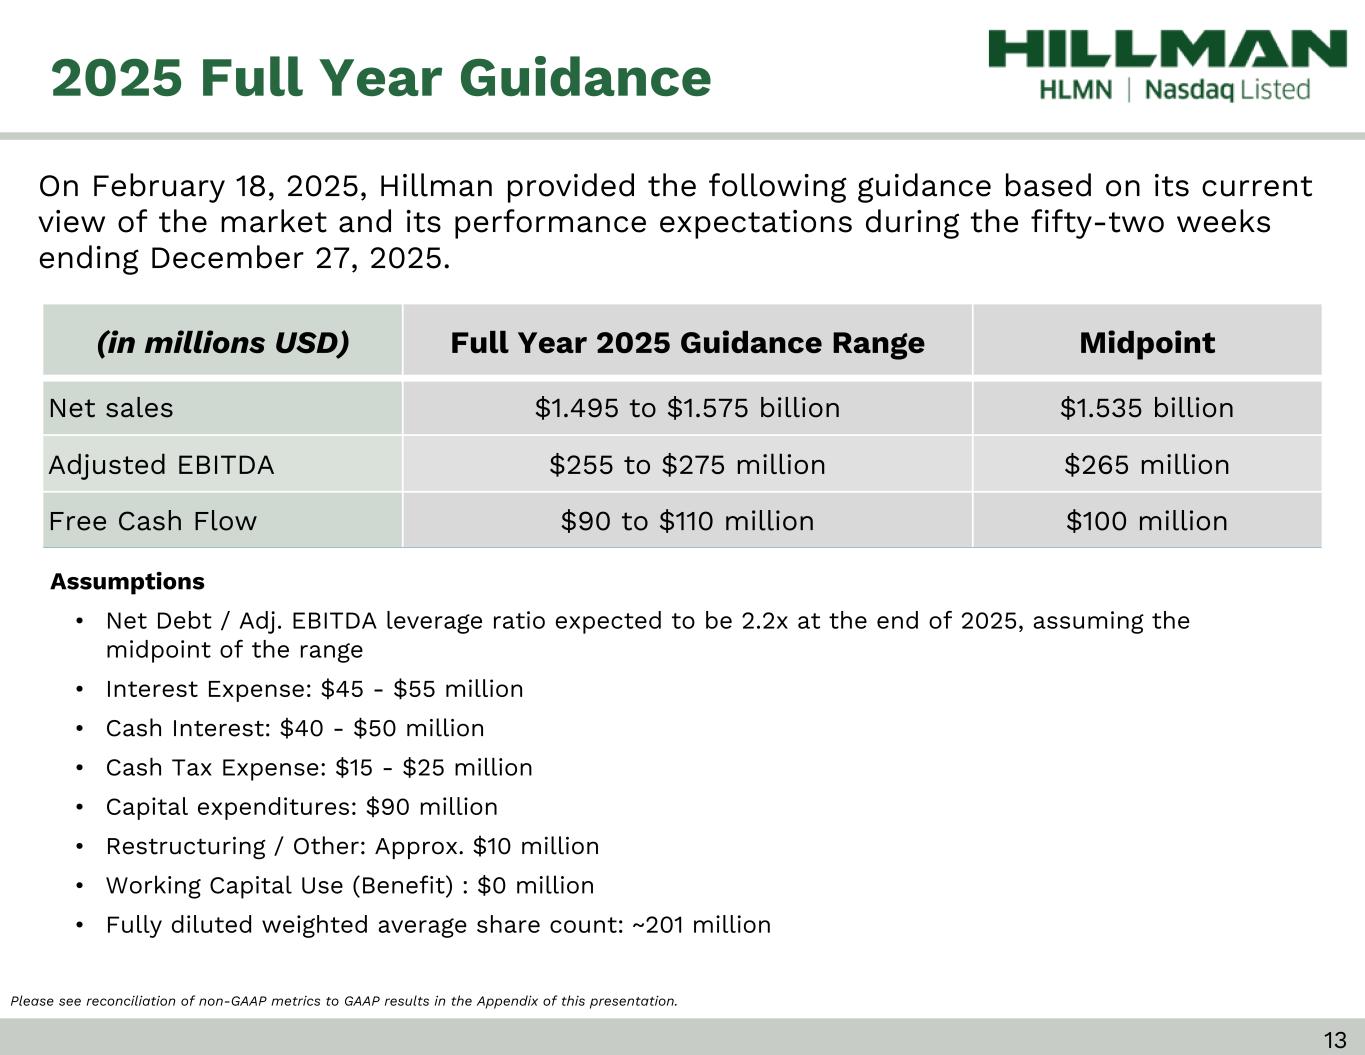
(in millions USD) Full Year 2025 Guidance Range Midpoint Net sales $1.495 to $1.575 billion $1.535 billion Adjusted EBITDA $255 to $275 million $265 million Free Cash Flow $90 to $110 million $100 million Assumptions • Net Debt / Adj. EBITDA leverage ratio expected to be 2.2x at the end of 2025, assuming the midpoint of the range • Interest Expense: $45 - $55 million • Cash Interest: $40 - $50 million • Cash Tax Expense: $15 - $25 million • Capital expenditures: $90 million • Restructuring / Other: Approx. $10 million • Working Capital Use (Benefit) : $0 million • Fully diluted weighted average share count: ~201 million 2025 Full Year Guidance On February 18, 2025, Hillman provided the following guidance based on its current view of the market and its performance expectations during the fifty-two weeks ending December 27, 2025. Please see reconciliation of non-GAAP metrics to GAAP results in the Appendix of this presentation. 13
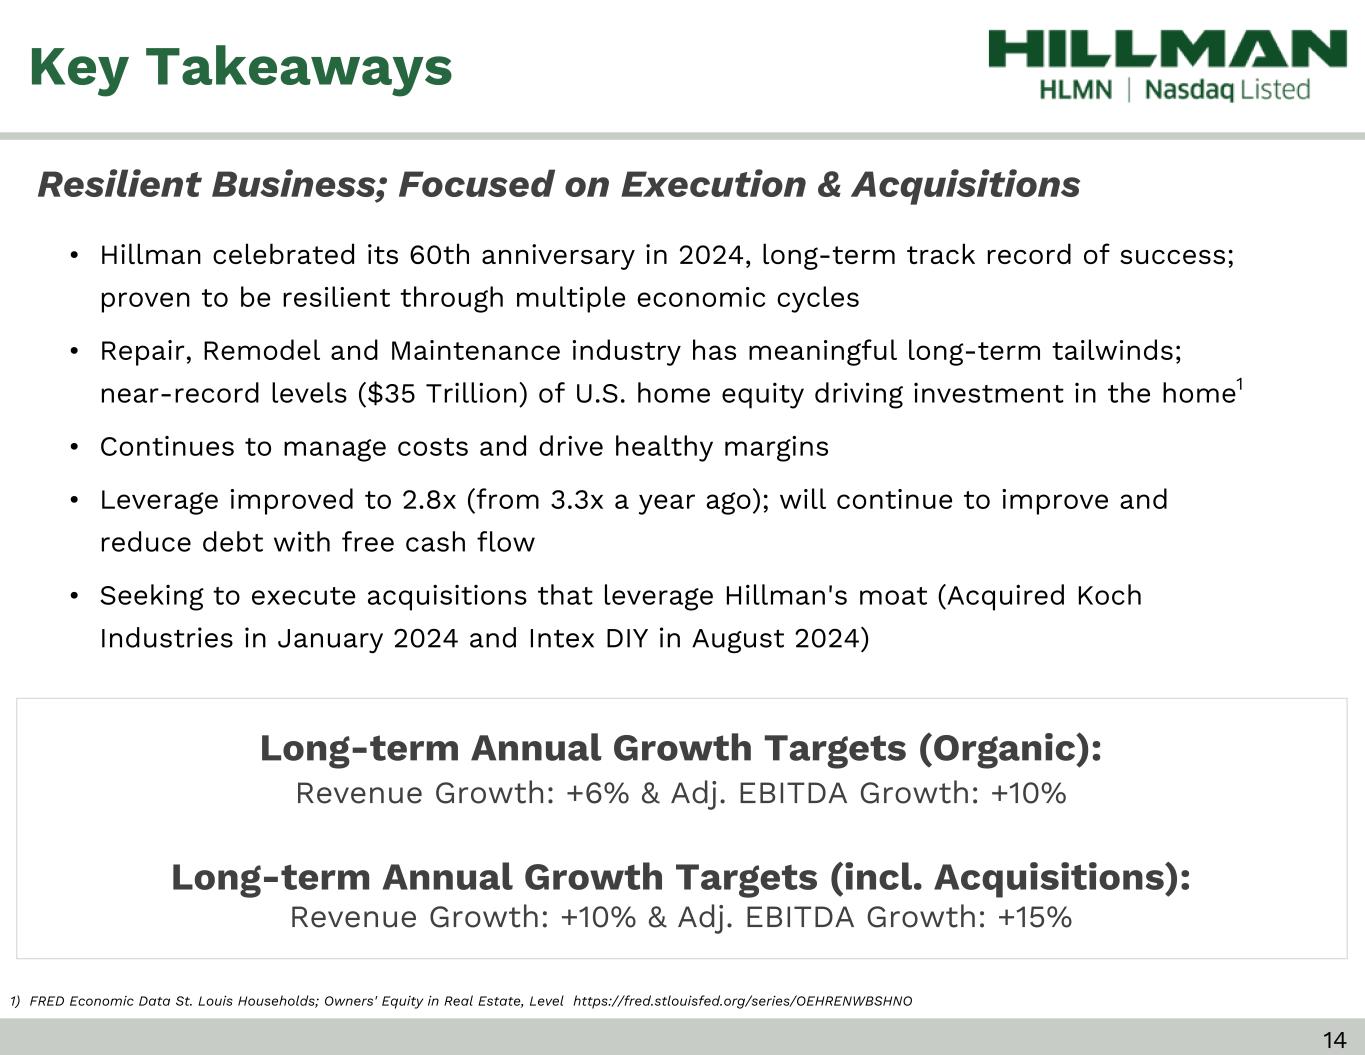
Key Takeaways Long-term Annual Growth Targets (Organic): Revenue Growth: +6% & Adj. EBITDA Growth: +10% Long-term Annual Growth Targets (incl. Acquisitions): Revenue Growth: +10% & Adj. EBITDA Growth: +15% • Hillman celebrated its 60th anniversary in 2024, long-term track record of success; proven to be resilient through multiple economic cycles • Repair, Remodel and Maintenance industry has meaningful long-term tailwinds; near-record levels ($35 Trillion) of U.S. home equity driving investment in the home1 • Continues to manage costs and drive healthy margins • Leverage improved to 2.8x (from 3.3x a year ago); will continue to improve and reduce debt with free cash flow • Seeking to execute acquisitions that leverage Hillman's moat (Acquired Koch Industries in January 2024 and Intex DIY in August 2024) Resilient Business; Focused on Execution & Acquisitions 14 1) FRED Economic Data St. Louis Households; Owners' Equity in Real Estate, Level https://fred.stlouisfed.org/series/OEHRENWBSHNO

Appendix
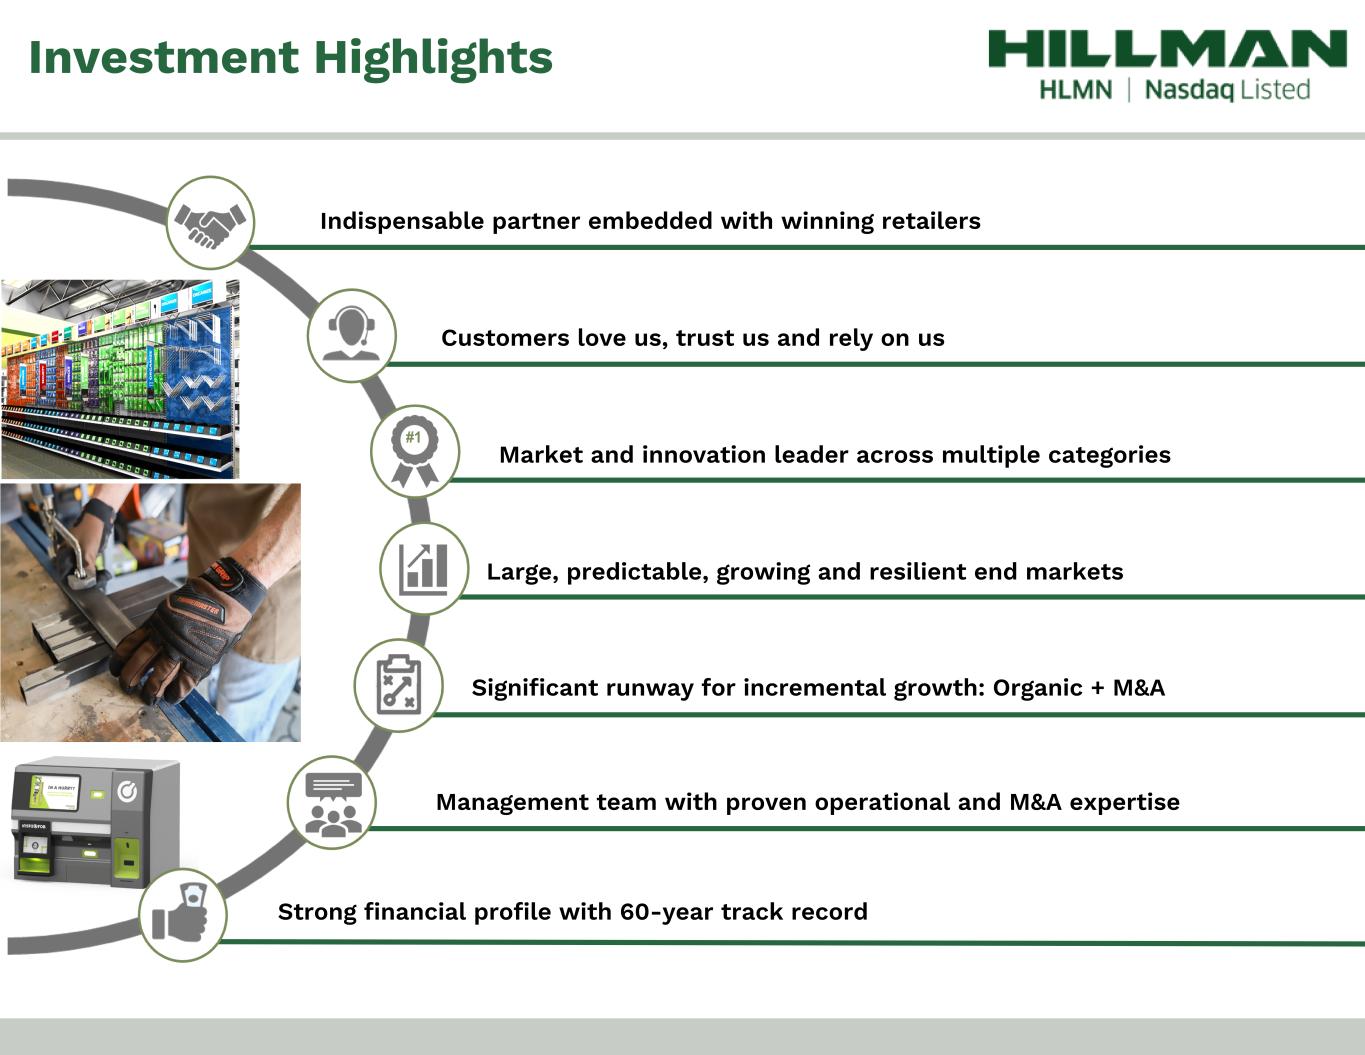
Significant runway for incremental growth: Organic + M&A Management team with proven operational and M&A expertise Strong financial profile with 60-year track record Market and innovation leader across multiple categories Indispensable partner embedded with winning retailers Customers love us, trust us and rely on us Large, predictable, growing and resilient end markets Investment Highlights 16
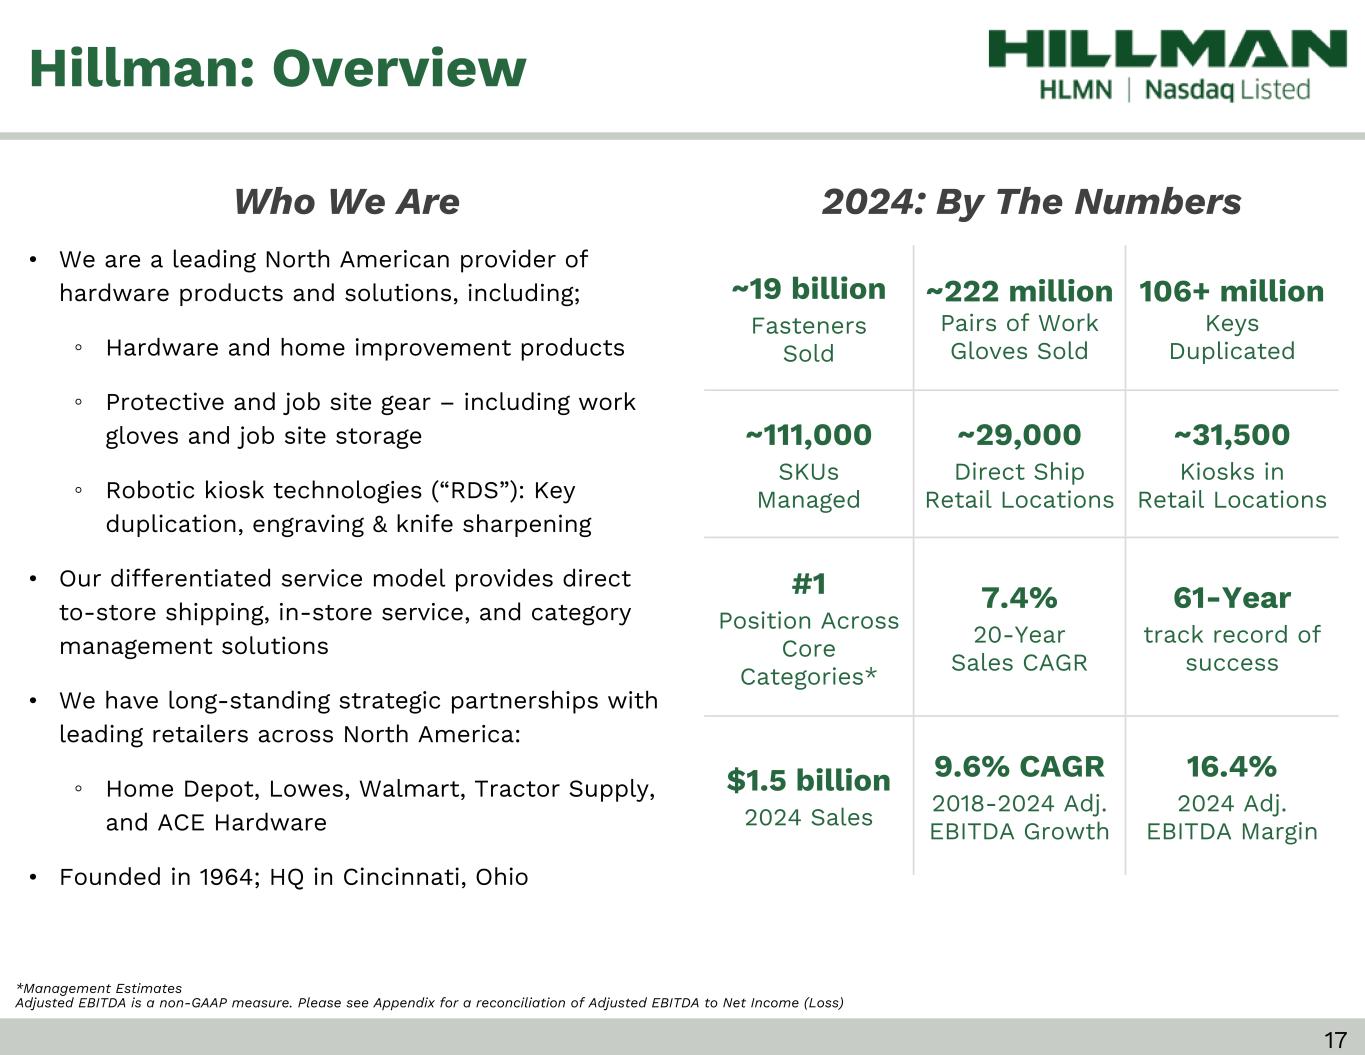
Who We Are *Management Estimates Adjusted EBITDA is a non-GAAP measure. Please see Appendix for a reconciliation of Adjusted EBITDA to Net Income (Loss) ~19 billion Fasteners Sold ~222 million Pairs of Work Gloves Sold 106+ million Keys Duplicated ~111,000 SKUs Managed ~29,000 Direct Ship Retail Locations ~31,500 Kiosks in Retail Locations #1 Position Across Core Categories* 7.4% 20-Year Sales CAGR 61-Year track record of success $1.5 billion 2024 Sales 9.6% CAGR 2018-2024 Adj. EBITDA Growth 16.4% 2024 Adj. EBITDA Margin Hillman: Overview 2024: By The Numbers • We are a leading North American provider of hardware products and solutions, including; ◦ Hardware and home improvement products ◦ Protective and job site gear – including work gloves and job site storage ◦ Robotic kiosk technologies (“RDS”): Key duplication, engraving & knife sharpening • Our differentiated service model provides direct to-store shipping, in-store service, and category management solutions • We have long-standing strategic partnerships with leading retailers across North America: ◦ Home Depot, Lowes, Walmart, Tractor Supply, and ACE Hardware • Founded in 1964; HQ in Cincinnati, Ohio 17
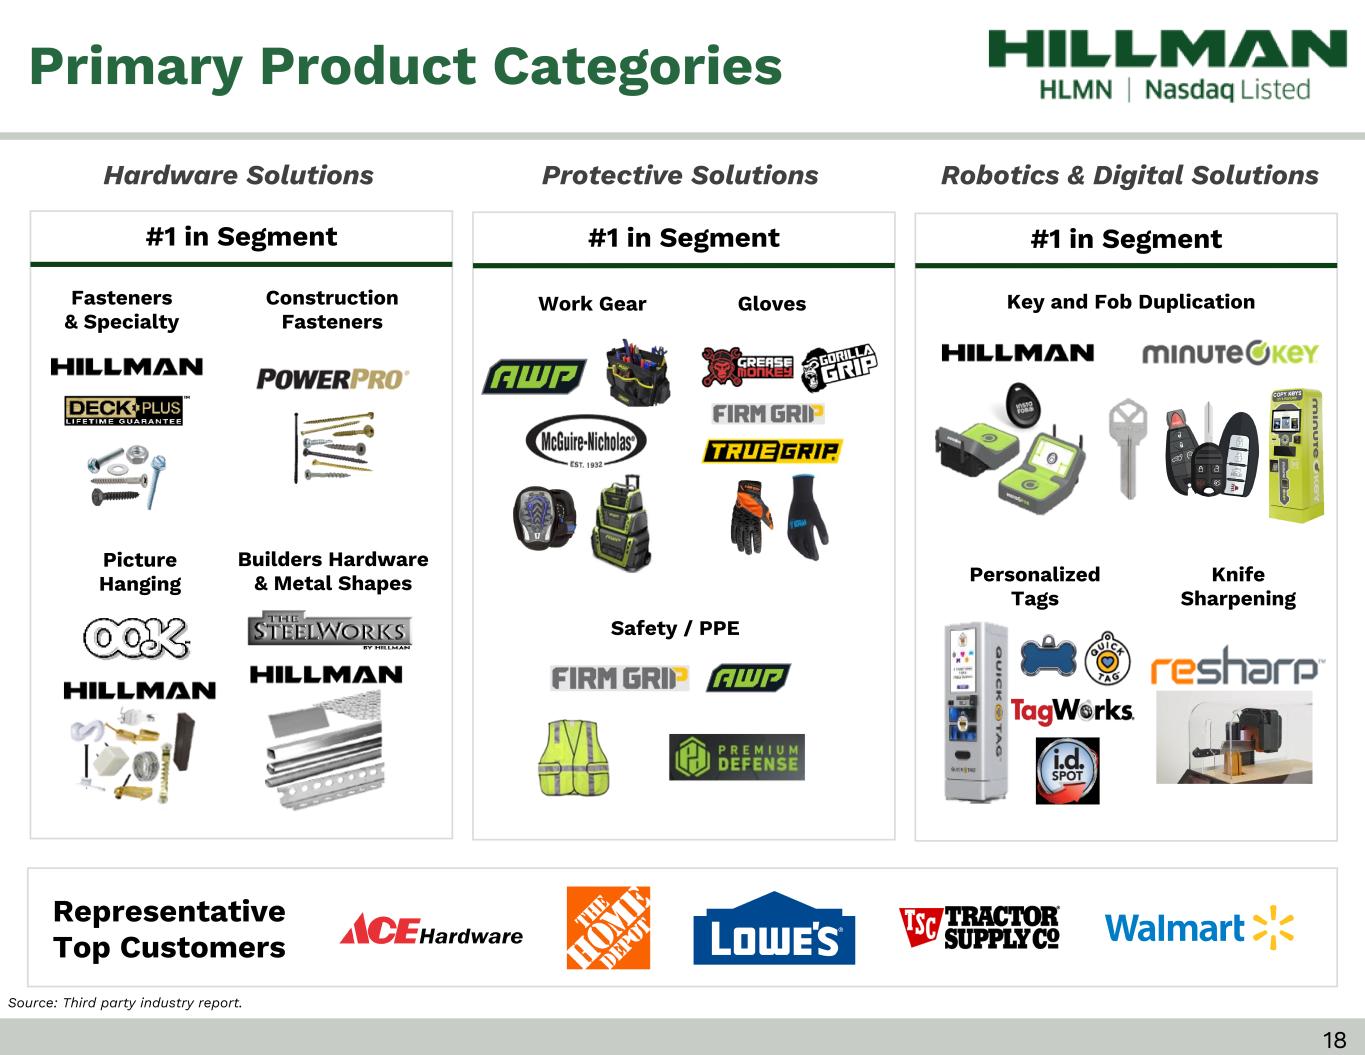
#1 in Segment Representative Top Customers #1 in Segment #1 in Segment Key and Fob Duplication Personalized Tags Knife Sharpening Fasteners & Specialty Gloves Builders Hardware & Metal Shapes Safety / PPE Construction Fasteners Work Gear Picture Hanging Source: Third party industry report. Primary Product Categories Hardware Solutions Robotics & Digital SolutionsProtective Solutions 18
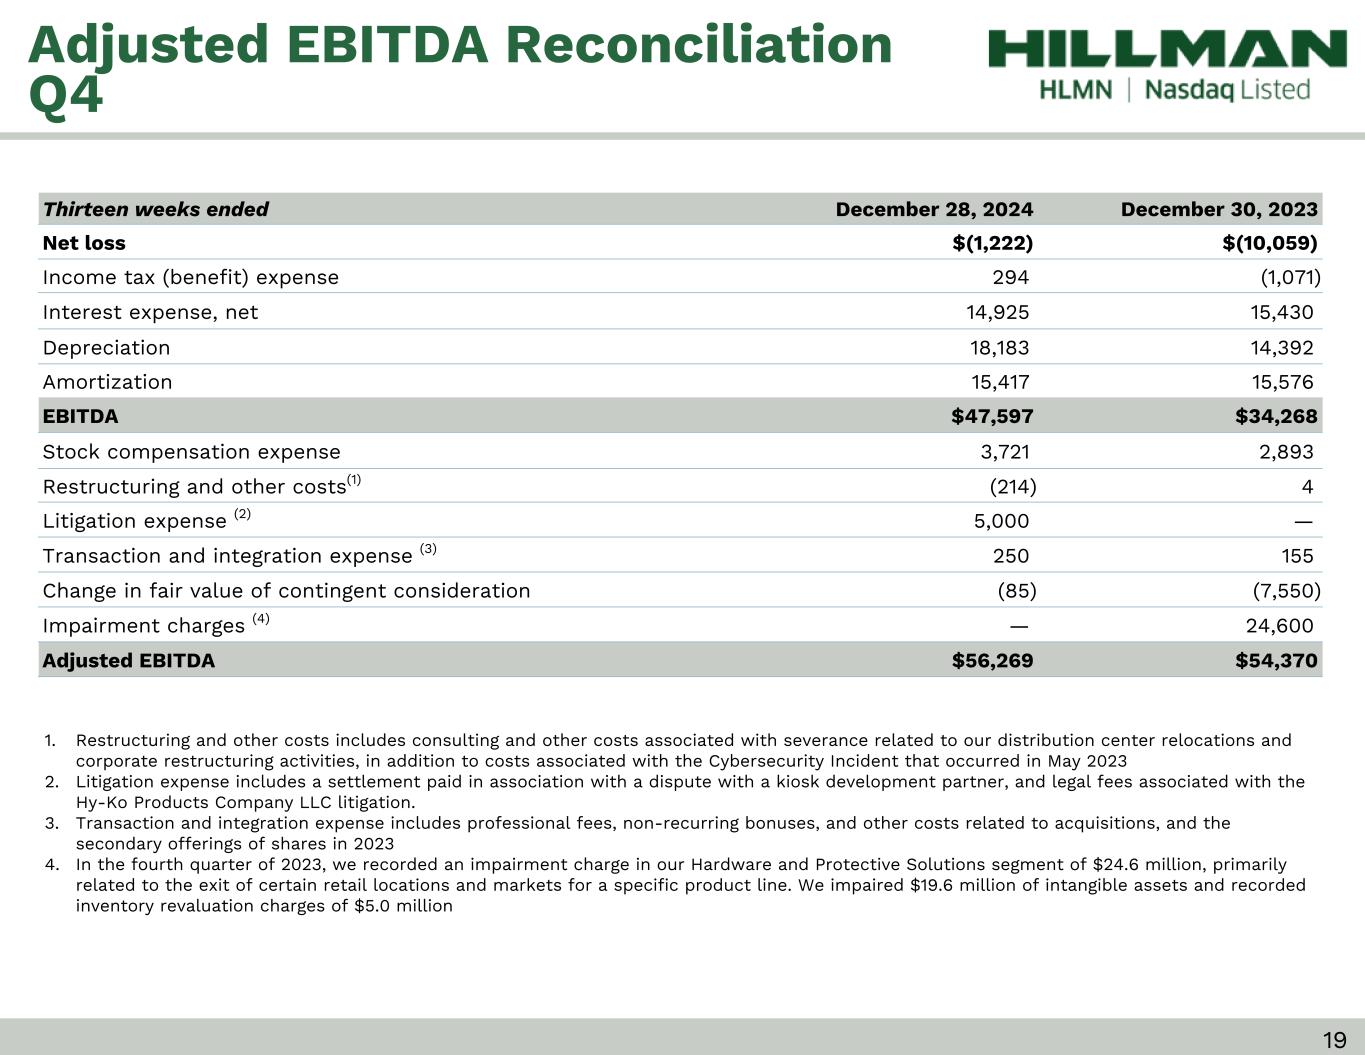
Thirteen weeks ended December 28, 2024 December 30, 2023 Net loss $(1,222) $(10,059) Income tax (benefit) expense 294 (1,071) Interest expense, net 14,925 15,430 Depreciation 18,183 14,392 Amortization 15,417 15,576 EBITDA $47,597 $34,268 Stock compensation expense 3,721 2,893 Restructuring and other costs(1) (214) 4 Litigation expense (2) 5,000 — Transaction and integration expense (3) 250 155 Change in fair value of contingent consideration (85) (7,550) Impairment charges (4) — 24,600 Adjusted EBITDA $56,269 $54,370 1. Restructuring and other costs includes consulting and other costs associated with severance related to our distribution center relocations and corporate restructuring activities, in addition to costs associated with the Cybersecurity Incident that occurred in May 2023 2. Litigation expense includes a settlement paid in association with a dispute with a kiosk development partner, and legal fees associated with the Hy-Ko Products Company LLC litigation. 3. Transaction and integration expense includes professional fees, non-recurring bonuses, and other costs related to acquisitions, and the secondary offerings of shares in 2023 4. In the fourth quarter of 2023, we recorded an impairment charge in our Hardware and Protective Solutions segment of $24.6 million, primarily related to the exit of certain retail locations and markets for a specific product line. We impaired $19.6 million of intangible assets and recorded inventory revaluation charges of $5.0 million Adjusted EBITDA Reconciliation Q4 19
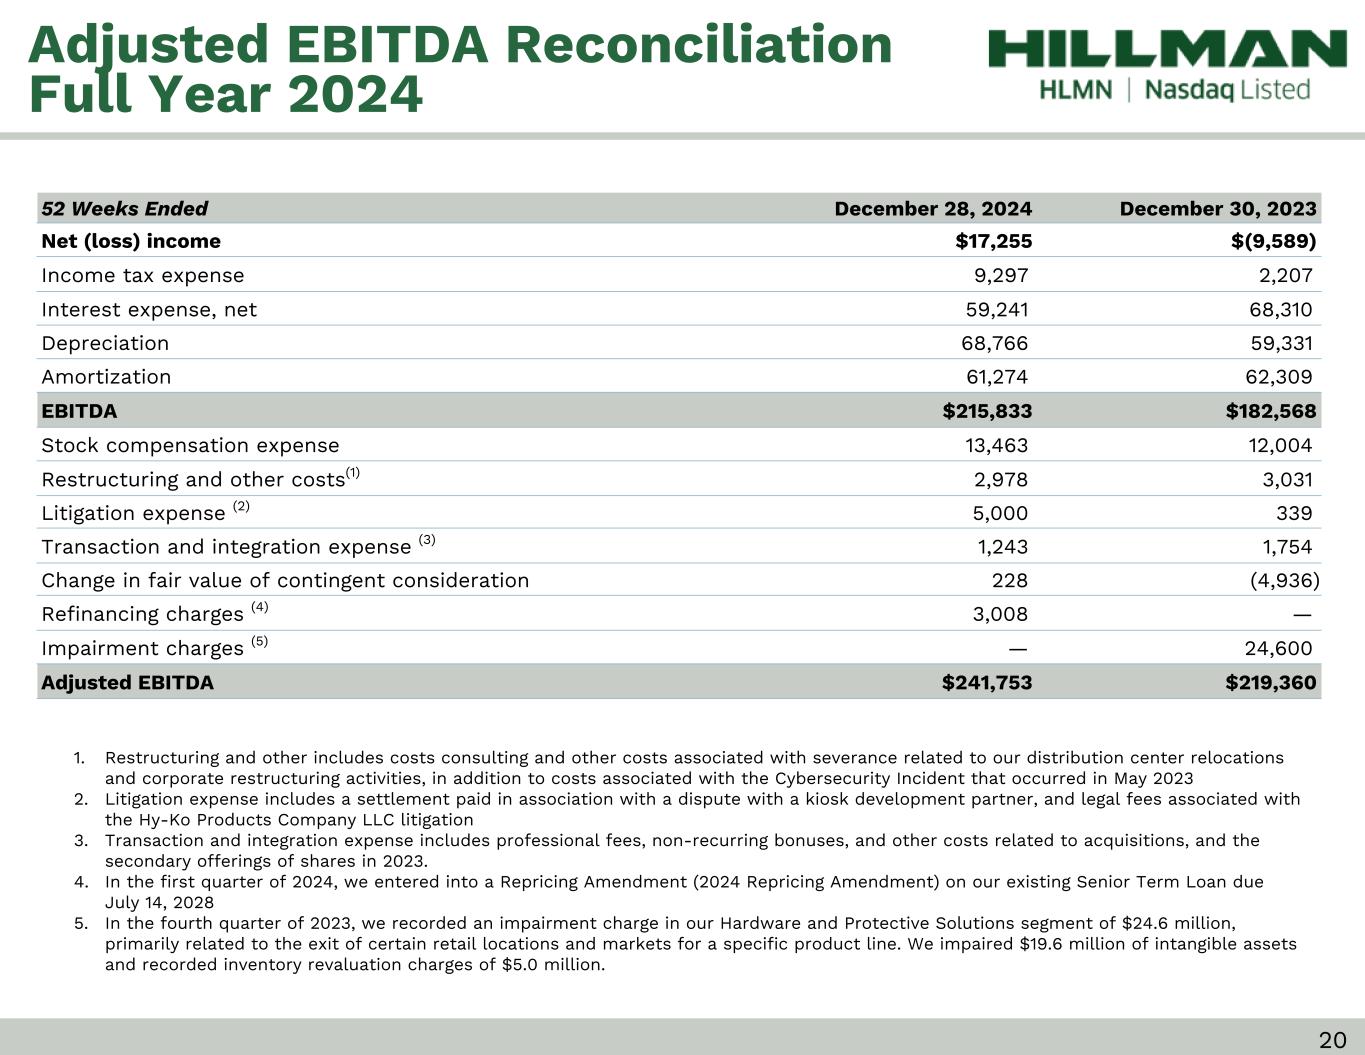
52 Weeks Ended December 28, 2024 December 30, 2023 Net (loss) income $17,255 $(9,589) Income tax expense 9,297 2,207 Interest expense, net 59,241 68,310 Depreciation 68,766 59,331 Amortization 61,274 62,309 EBITDA $215,833 $182,568 Stock compensation expense 13,463 12,004 Restructuring and other costs(1) 2,978 3,031 Litigation expense (2) 5,000 339 Transaction and integration expense (3) 1,243 1,754 Change in fair value of contingent consideration 228 (4,936) Refinancing charges (4) 3,008 — Impairment charges (5) — 24,600 Adjusted EBITDA $241,753 $219,360 Adjusted EBITDA Reconciliation Full Year 2024 1. Restructuring and other includes costs consulting and other costs associated with severance related to our distribution center relocations and corporate restructuring activities, in addition to costs associated with the Cybersecurity Incident that occurred in May 2023 2. Litigation expense includes a settlement paid in association with a dispute with a kiosk development partner, and legal fees associated with the Hy-Ko Products Company LLC litigation 3. Transaction and integration expense includes professional fees, non-recurring bonuses, and other costs related to acquisitions, and the secondary offerings of shares in 2023. 4. In the first quarter of 2024, we entered into a Repricing Amendment (2024 Repricing Amendment) on our existing Senior Term Loan due July 14, 2028 5. In the fourth quarter of 2023, we recorded an impairment charge in our Hardware and Protective Solutions segment of $24.6 million, primarily related to the exit of certain retail locations and markets for a specific product line. We impaired $19.6 million of intangible assets and recorded inventory revaluation charges of $5.0 million. 20
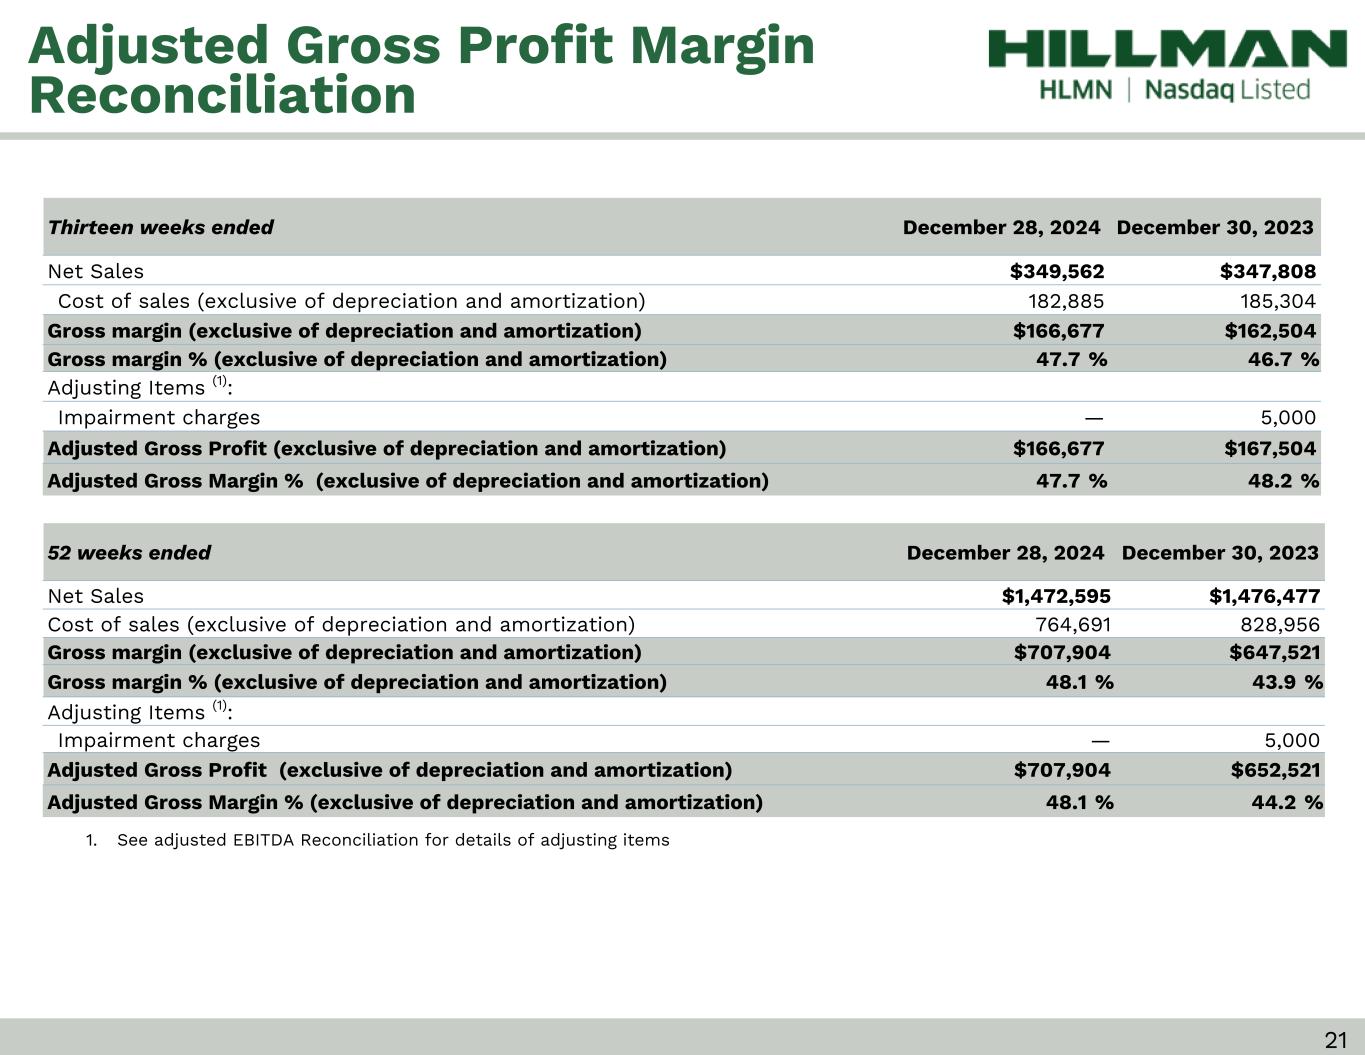
Thirteen weeks ended December 28, 2024 December 30, 2023 Net Sales $349,562 $347,808 Cost of sales (exclusive of depreciation and amortization) 182,885 185,304 Gross margin (exclusive of depreciation and amortization) $166,677 $162,504 Gross margin % (exclusive of depreciation and amortization) 47.7 % 46.7 % Adjusting Items (1): Impairment charges — 5,000 Adjusted Gross Profit (exclusive of depreciation and amortization) $166,677 $167,504 Adjusted Gross Margin % (exclusive of depreciation and amortization) 47.7 % 48.2 % Adjusted Gross Profit Margin Reconciliation 52 weeks ended December 28, 2024 December 30, 2023 Net Sales $1,472,595 $1,476,477 Cost of sales (exclusive of depreciation and amortization) 764,691 828,956 Gross margin (exclusive of depreciation and amortization) $707,904 $647,521 Gross margin % (exclusive of depreciation and amortization) 48.1 % 43.9 % Adjusting Items (1): Impairment charges — 5,000 Adjusted Gross Profit (exclusive of depreciation and amortization) $707,904 $652,521 Adjusted Gross Margin % (exclusive of depreciation and amortization) 48.1 % 44.2 % 1. See adjusted EBITDA Reconciliation for details of adjusting items 21
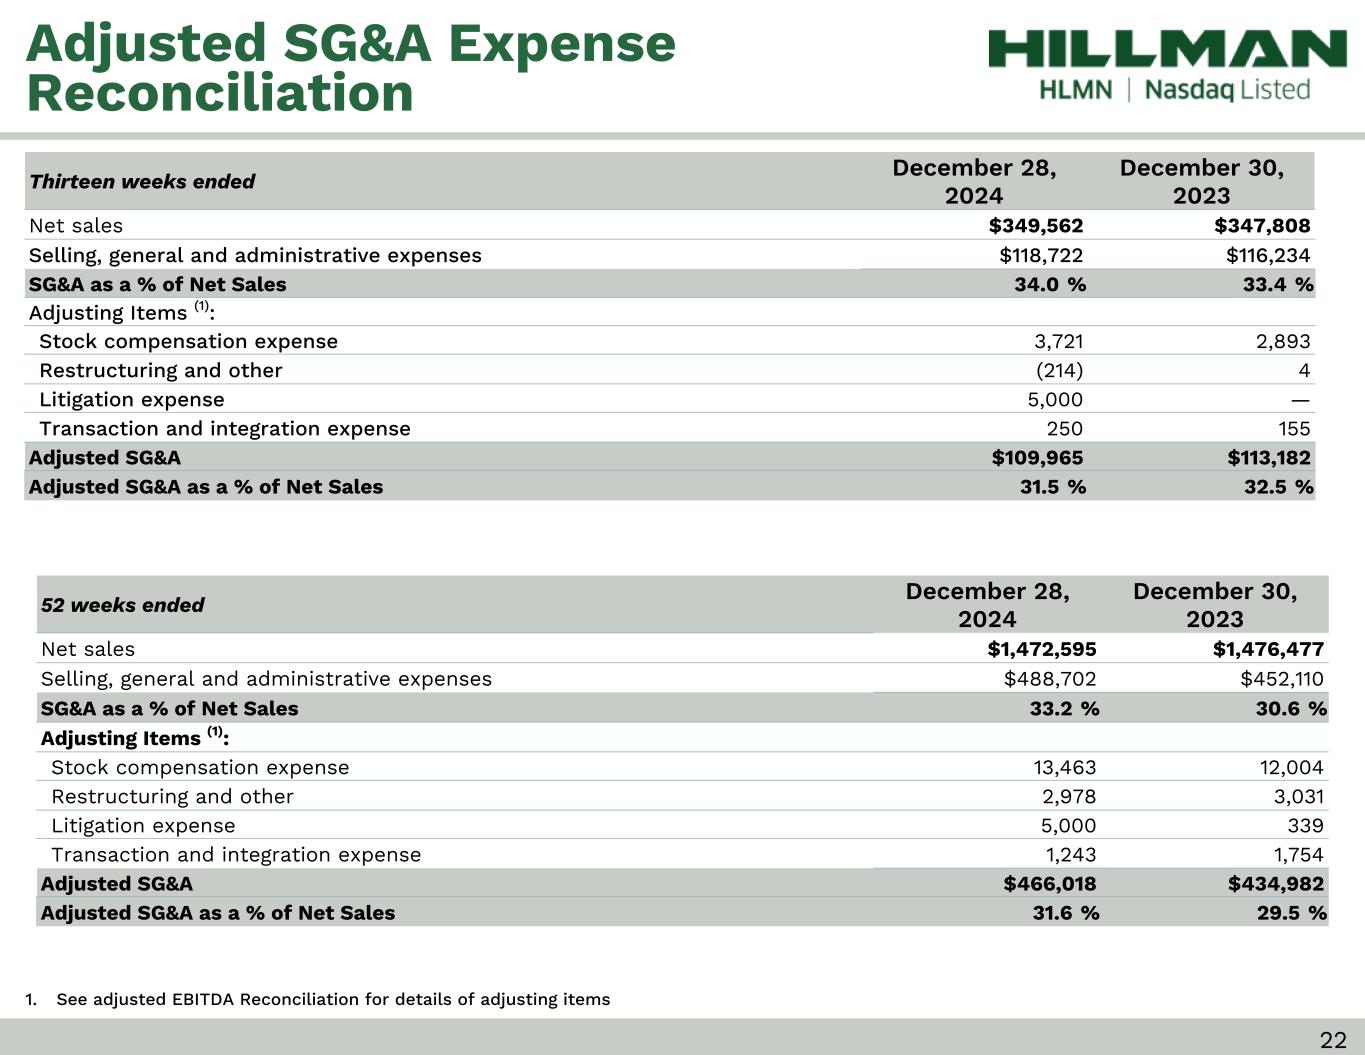
Thirteen weeks ended December 28, 2024 December 30, 2023 Net sales $349,562 $347,808 Selling, general and administrative expenses $118,722 $116,234 SG&A as a % of Net Sales 34.0 % 33.4 % Adjusting Items (1): Stock compensation expense 3,721 2,893 Restructuring and other (214) 4 Litigation expense 5,000 — Transaction and integration expense 250 155 Adjusted SG&A $109,965 $113,182 Adjusted SG&A as a % of Net Sales 31.5 % 32.5 % Adjusted SG&A Expense Reconciliation 1. See adjusted EBITDA Reconciliation for details of adjusting items 52 weeks ended December 28, 2024 December 30, 2023 Net sales $1,472,595 $1,476,477 Selling, general and administrative expenses $488,702 $452,110 SG&A as a % of Net Sales 33.2 % 30.6 % Adjusting Items (1): Stock compensation expense 13,463 12,004 Restructuring and other 2,978 3,031 Litigation expense 5,000 339 Transaction and integration expense 1,243 1,754 Adjusted SG&A $466,018 $434,982 Adjusted SG&A as a % of Net Sales 31.6 % 29.5 % 22
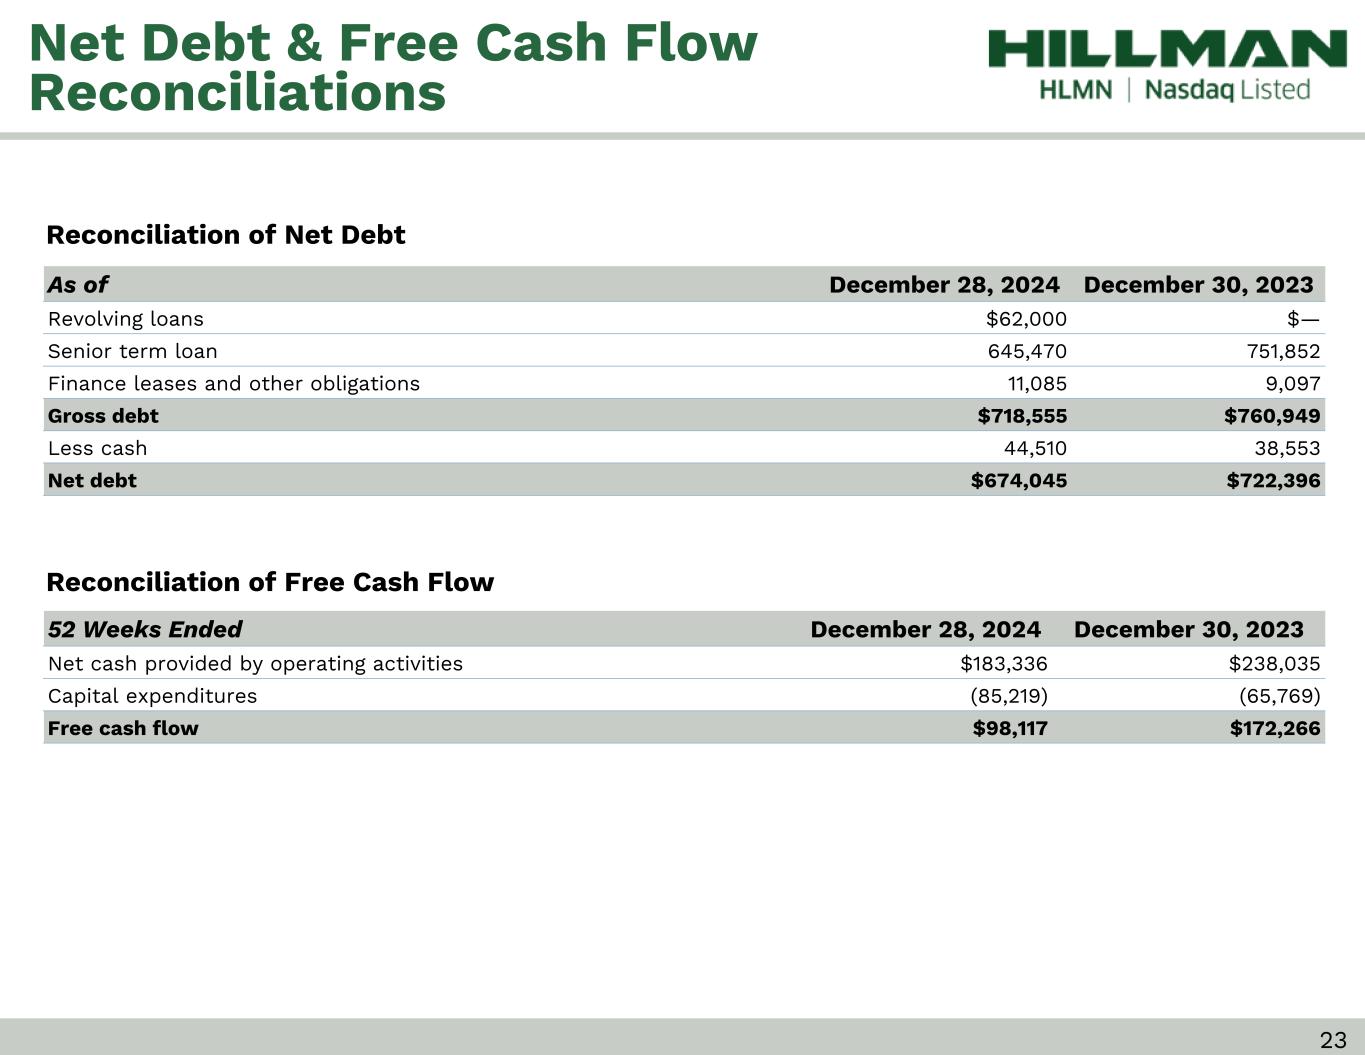
As of December 28, 2024 December 30, 2023 Revolving loans $62,000 $— Senior term loan 645,470 751,852 Finance leases and other obligations 11,085 9,097 Gross debt $718,555 $760,949 Less cash 44,510 38,553 Net debt $674,045 $722,396 Net Debt & Free Cash Flow Reconciliations 52 Weeks Ended December 28, 2024 December 30, 2023 Net cash provided by operating activities $183,336 $238,035 Capital expenditures (85,219) (65,769) Free cash flow $98,117 $172,266 Reconciliation of Net Debt Reconciliation of Free Cash Flow 23
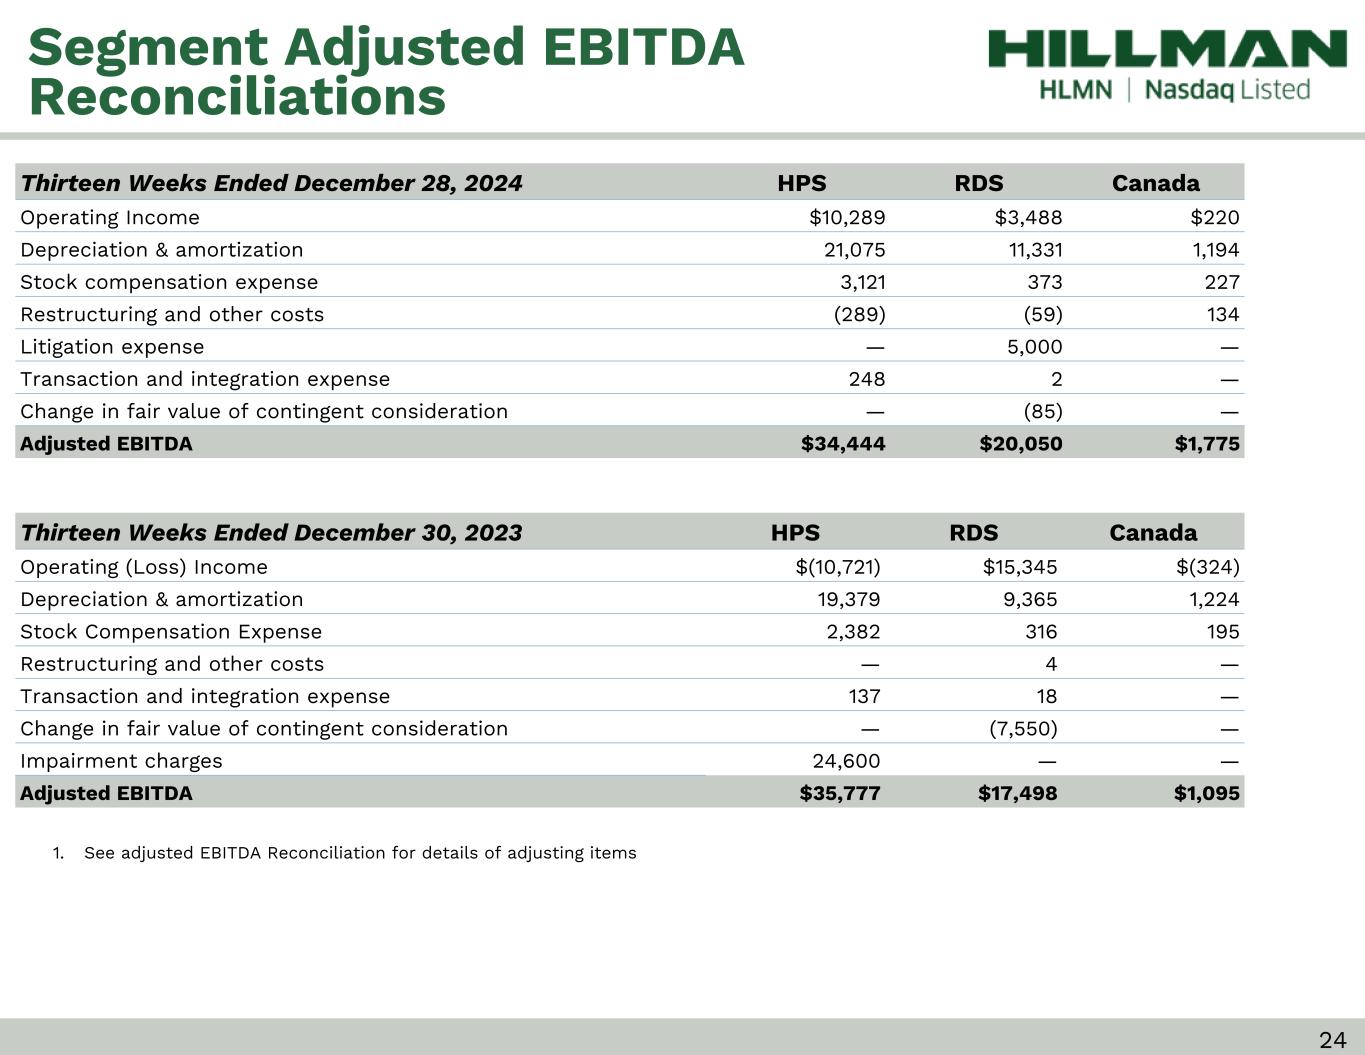
Thirteen Weeks Ended December 28, 2024 HPS RDS Canada Operating Income $10,289 $3,488 $220 Depreciation & amortization 21,075 11,331 1,194 Stock compensation expense 3,121 373 227 Restructuring and other costs (289) (59) 134 Litigation expense — 5,000 — Transaction and integration expense 248 2 — Change in fair value of contingent consideration — (85) — Adjusted EBITDA $34,444 $20,050 $1,775 Thirteen Weeks Ended December 30, 2023 HPS RDS Canada Operating (Loss) Income $(10,721) $15,345 $(324) Depreciation & amortization 19,379 9,365 1,224 Stock Compensation Expense 2,382 316 195 Restructuring and other costs — 4 — Transaction and integration expense 137 18 — Change in fair value of contingent consideration — (7,550) — Impairment charges 24,600 — — Adjusted EBITDA $35,777 $17,498 $1,095 1. See adjusted EBITDA Reconciliation for details of adjusting items 24 Segment Adjusted EBITDA Reconciliations
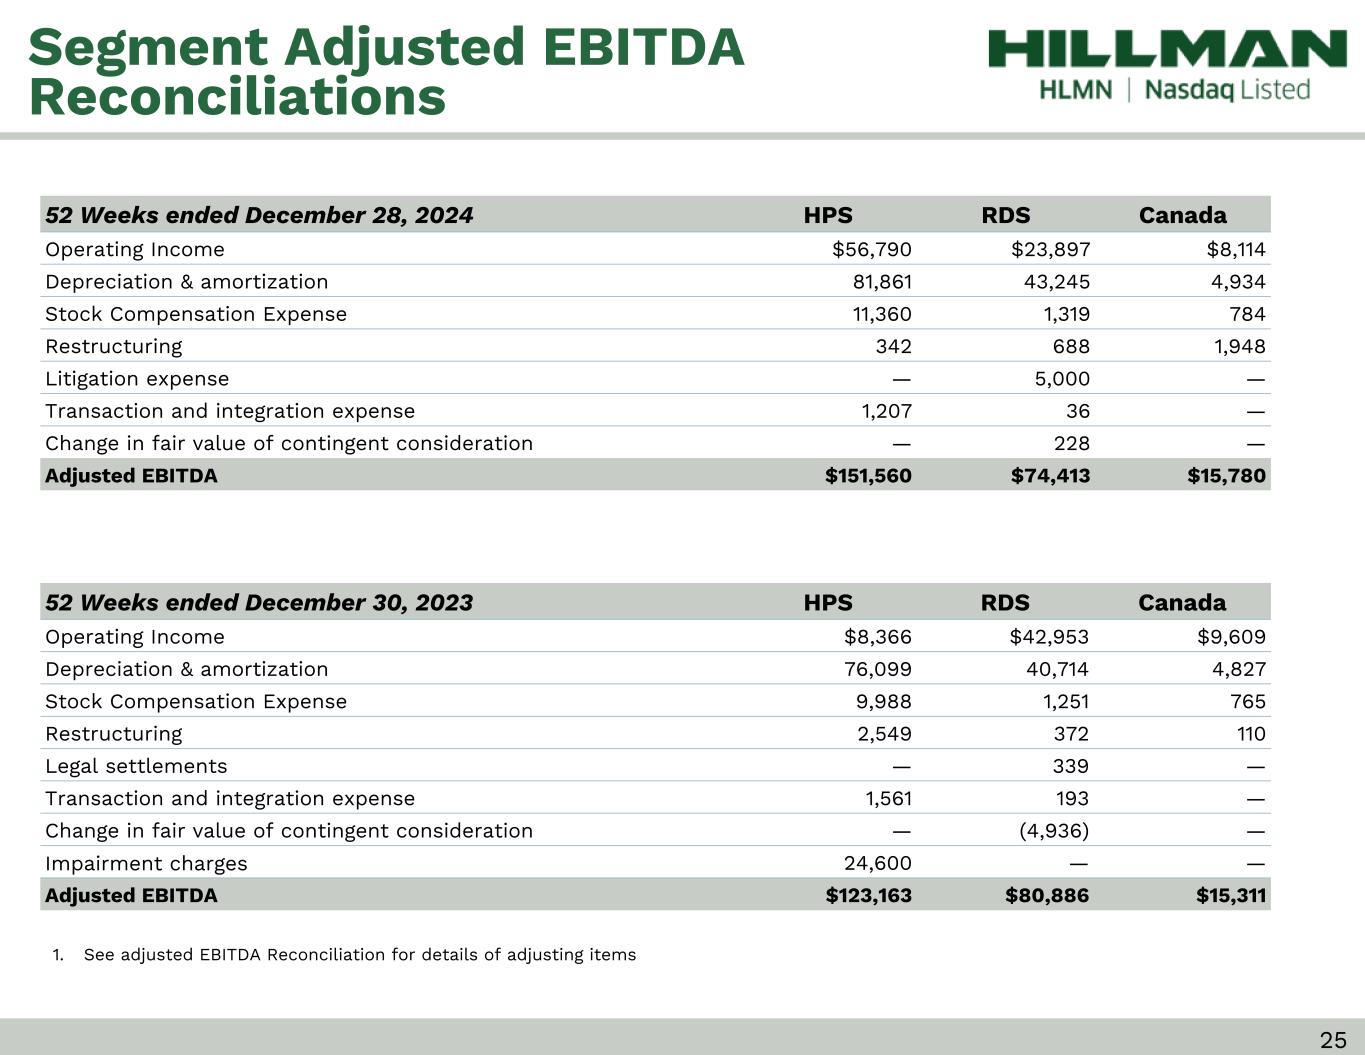
52 Weeks ended December 28, 2024 HPS RDS Canada Operating Income $56,790 $23,897 $8,114 Depreciation & amortization 81,861 43,245 4,934 Stock Compensation Expense 11,360 1,319 784 Restructuring 342 688 1,948 Litigation expense — 5,000 — Transaction and integration expense 1,207 36 — Change in fair value of contingent consideration — 228 — Adjusted EBITDA $151,560 $74,413 $15,780 52 Weeks ended December 30, 2023 HPS RDS Canada Operating Income $8,366 $42,953 $9,609 Depreciation & amortization 76,099 40,714 4,827 Stock Compensation Expense 9,988 1,251 765 Restructuring 2,549 372 110 Legal settlements — 339 — Transaction and integration expense 1,561 193 — Change in fair value of contingent consideration — (4,936) — Impairment charges 24,600 — — Adjusted EBITDA $123,163 $80,886 $15,311 Segment Adjusted EBITDA Reconciliations 1. See adjusted EBITDA Reconciliation for details of adjusting items 25