EX-99.2
Published on March 2, 2022

235 235 235 56 115 144 36 90 87 61 61 61 180 180 180 147 183 201 30 140 130 Investor Presentation Fourth Quarter 2021
103 176 13 12 63 19 199 204 199 0 0 0 199 199 199 2 Safe Harbor Statement Forward Looking Statements PresBuilder Placeholder - Delete this box if you see it on a slide, but DO NOT REMOVE this box from the slide layout 2 This presentation may contain “forward-looking statements” within the meaning of federal securities laws. All statements other than statements of historical fact included in this presentation are forward-looking statements made in good faith by the company and are intended to qualify for the safe harbor from liability established by the Private Securities Litigation Reform Act of 1995. The Company's actual results may differ from their expectations, estimates and projections and consequently, you should not rely on these forward-looking statements as predictions of future events. Words such as "expect," "estimate," "project," "budget," "forecast," "anticipate," "intend," "plan," "may," "will," "could," "should," "believes," "predicts," "potential," "continue," and similar expressions are intended to identify such forward-looking statements. These forward-looking statements include, without limitation, the Company’s expectations with respect to future performance. These forward-looking statements involve significant risks and uncertainties that could cause the actual results to differ materially from the expected results. Most of these factors are outside the Company's control and are difficult to predict. Factors that may cause such differences include, but are not limited to: (1) unfavorable economic conditions that may affect operations, financial condition and cash flows including inflation, recessions, instability in the financial markets or credit markets; (2) highly competitive markets that could adversely impact financial results (3) ability to continue to innovate with new products and services; (4) seasonality; (5) large customer concentration; (6) ability to recruit and retain qualified employees; (7) the outcome of any legal proceedings that may be instituted against the Company (8) adverse changes in currency exchange rates; (9) the impact of COVID-19 on the Company’s business; or (10) regulatory changes and potential legislation that could adversely impact financial results. The foregoing list of factors is not exclusive, and readers should also refer to those risks that will be included under the header “Risk Factors” included in the S-1 filed on August 25, 2021 with the Securities and Exchange Commission (“SEC”). Given these uncertainties, current or prospective investors are cautioned not to place undue reliance on any such forward looking statements. The Company does not undertake or accept any obligation or undertaking to release publicly any updates or revisions to any forward-looking statements in this presentation to reflect any change in its expectations or any change in events, conditions or circumstances on which any such statement is based. All estimates of financial metrics in this presentation for fiscal 2021 and beyond are current as of March 2, 2022. Presentation of Non-GAAP Financial Measures In addition to the results provided in accordance with U.S. generally accepted accounting principles (“GAAP”) throughout this presentation the company has provided non-GAAP financial measures, which present results on a basis adjusted for certain items. The company uses these non-GAAP financial measures for business planning purposes and in measuring its performance relative to that of its competitors. The company believes that these non-GAAP financial measures are useful financial metrics to assess its operating performance from period-to-period by excluding certain items that the company believes are not representative of its core business. These non-GAAP financial measures are not intended to replace, and should not be considered superior to, the presentation of the company’s financial results in accordance with GAAP. The use of the non-GAAP financial measures terms may differ from similar measures reported by other companies and may not be comparable to other similarly titled measures. These non-GAAP financial measures are reconciled from the respective measures under GAAP in the appendix below. The company is not able to provide a reconciliation of the company’s non-GAAP financial guidance to the corresponding GAAP measures without unreasonable effort because of the inherent difficulty in forecasting and quantifying certain amounts necessary for such a reconciliation such as certain non- cash, nonrecurring or other items that are included in net income and EBITDA as well as the related tax impacts of these items and asset dispositions / acquisitions and changes in foreign currency exchange rates that are included in cash flow, due to the uncertainty and variability of the nature and amount of these future charges and costs.

103 176 13 3 2021 REVIEW
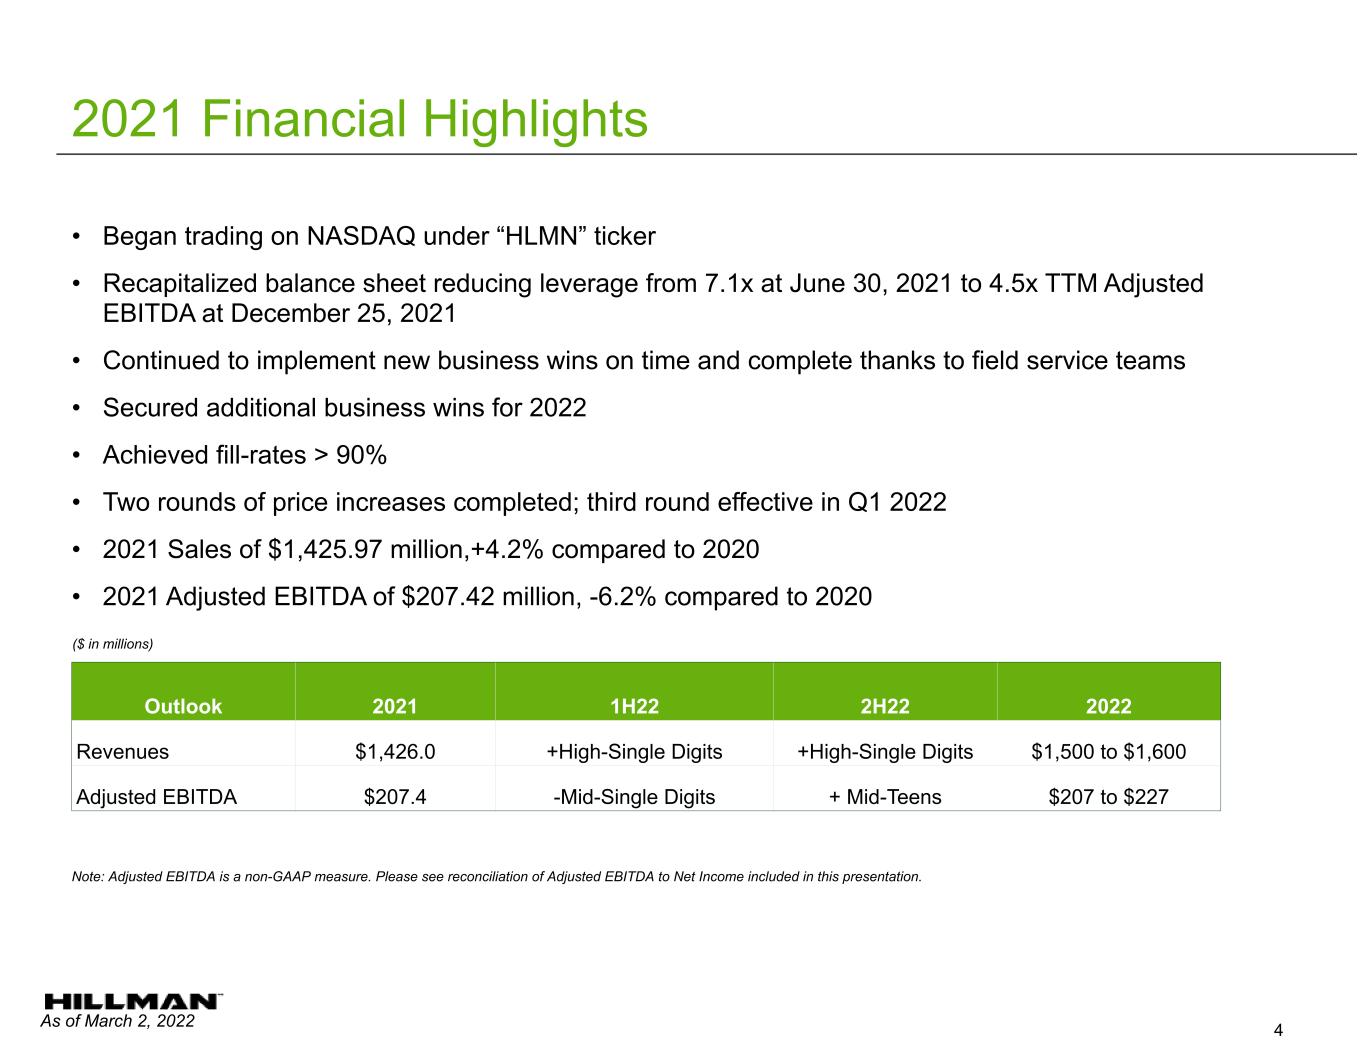
103 176 13 12 63 19 199 204 199 0 0 0 199 199 199 4 2021 Financial Highlights 4 • Began trading on NASDAQ under “HLMN” ticker • Recapitalized balance sheet reducing leverage from 7.1x at June 30, 2021 to 4.5x TTM Adjusted EBITDA at December 25, 2021 • Continued to implement new business wins on time and complete thanks to field service teams • Secured additional business wins for 2022 • Achieved fill-rates > 90% • Two rounds of price increases completed; third round effective in Q1 2022 • 2021 Sales of $1,425.97 million,+4.2% compared to 2020 • 2021 Adjusted EBITDA of $207.42 million, -6.2% compared to 2020 Note: Adjusted EBITDA is a non-GAAP measure. Please see reconciliation of Adjusted EBITDA to Net Income included in this presentation. Outlook 2021 1H22 2H22 2022 Revenues $1,426.0 +High-Single Digits +High-Single Digits $1,500 to $1,600 Adjusted EBITDA $207.4 -Mid-Single Digits + Mid-Teens $207 to $227 As of March 2, 2022 ($ in millions)
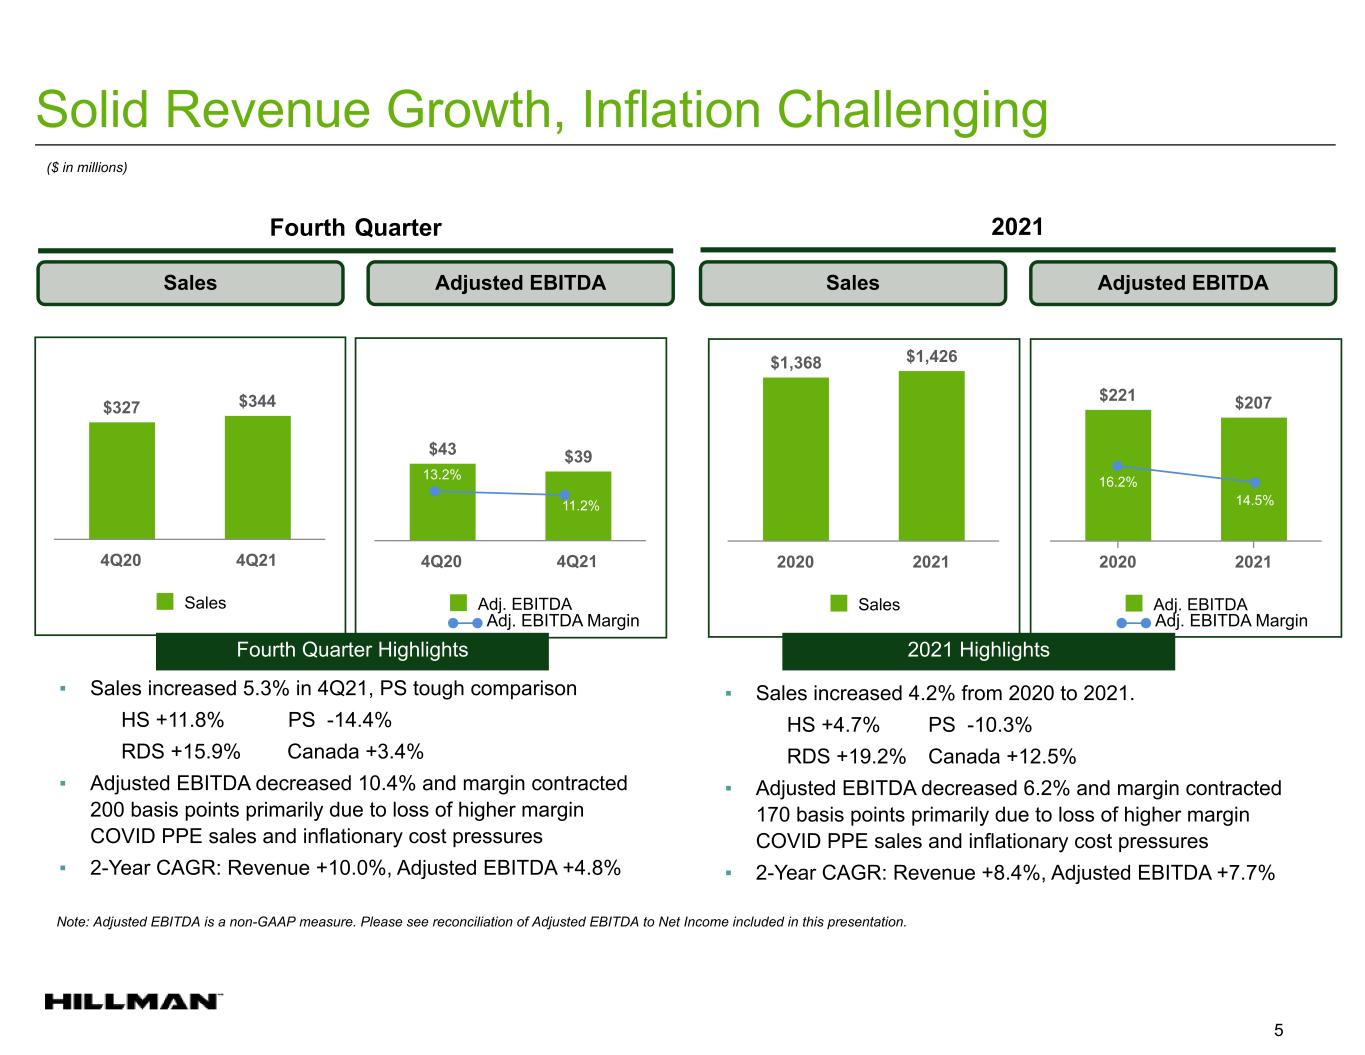
103 176 13 12 63 19 199 204 199 0 0 0 199 199 199 5 Solid Revenue Growth, Inflation Challenging 5 Fourth Quarter 2021 Sales Adjusted EBITDA Sales Adjusted EBITDA ▪ Sales increased 5.3% in 4Q21, PS tough comparison HS +11.8% PS -14.4% RDS +15.9% Canada +3.4% ▪ Adjusted EBITDA decreased 10.4% and margin contracted 200 basis points primarily due to loss of higher margin COVID PPE sales and inflationary cost pressures ▪ 2-Year CAGR: Revenue +10.0%, Adjusted EBITDA +4.8% ($ in millions) ▪ Sales increased 4.2% from 2020 to 2021. HS +4.7% PS -10.3% RDS +19.2% Canada +12.5% ▪ Adjusted EBITDA decreased 6.2% and margin contracted 170 basis points primarily due to loss of higher margin COVID PPE sales and inflationary cost pressures ▪ 2-Year CAGR: Revenue +8.4%, Adjusted EBITDA +7.7% Fourth Quarter Highlights 2021 Highlights $327 $344 Sales 4Q20 4Q21 $43 $39 Adj. EBITDA 4Q20 4Q21 11.2% Adj. EBITDA Margin $1,368 $1,426 Sales 2020 2021 $221 $207 Adj. EBITDA 2020 2021 16.2% 14.5% Adj. EBITDA Margin 13.2% Note: Adjusted EBITDA is a non-GAAP measure. Please see reconciliation of Adjusted EBITDA to Net Income included in this presentation.
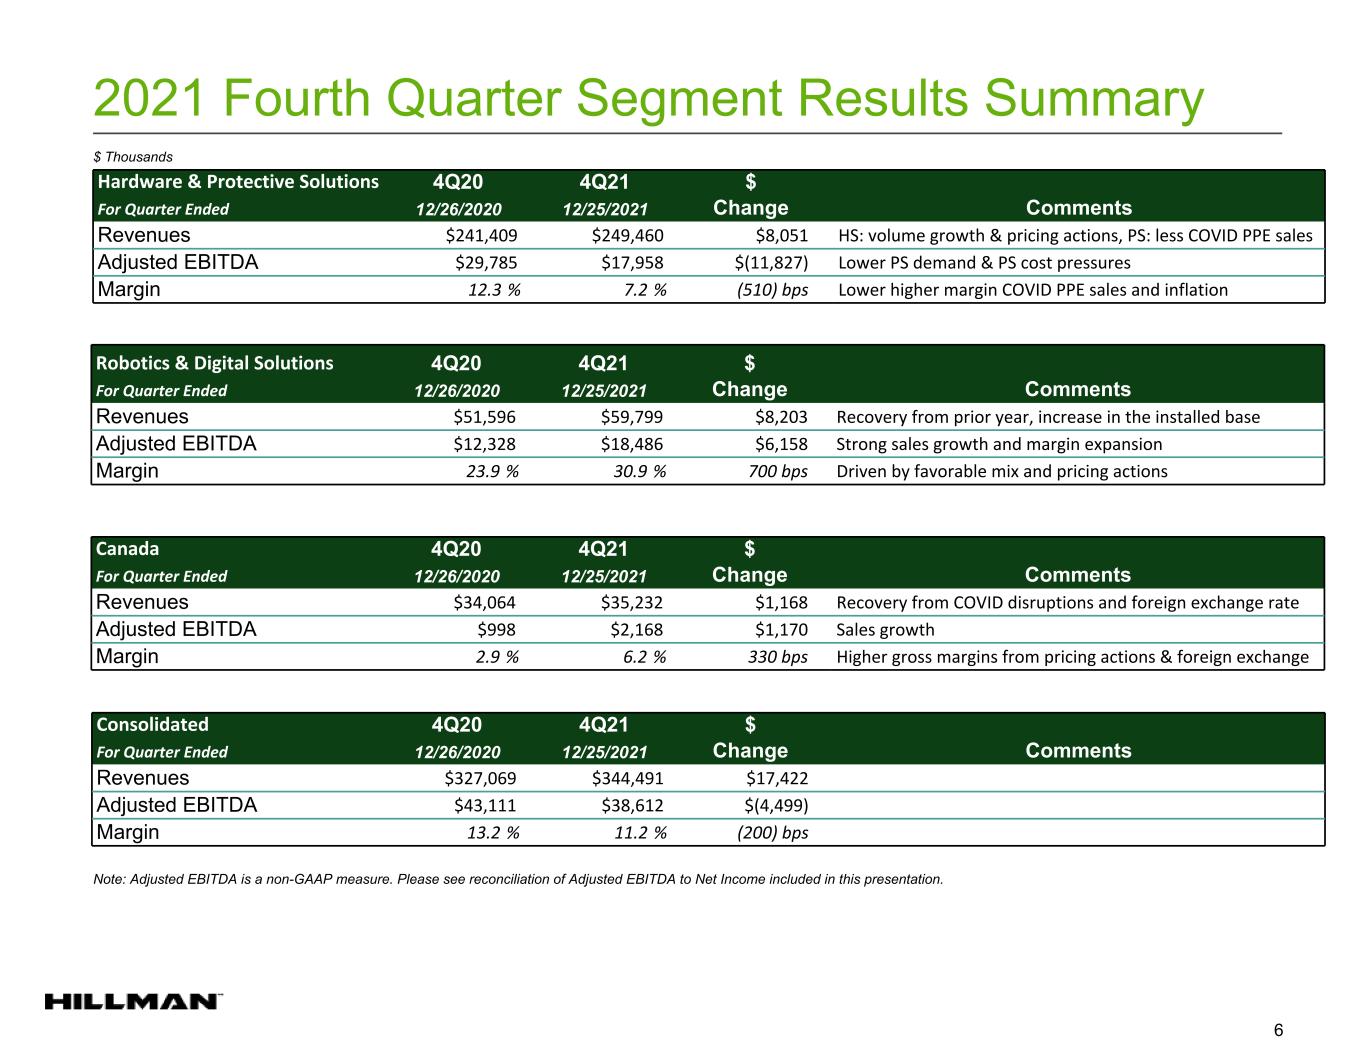
103 176 13 12 63 19 199 204 199 0 0 0 199 199 199 6 2021 Fourth Quarter Segment Results Summary 6 Hardware & Protective Solutions 4Q20 4Q21 $ For Quarter Ended 12/26/2020 12/25/2021 Change Comments Revenues $241,409 $249,460 $8,051 HS: volume growth & pricing actions, PS: less COVID PPE sales Adjusted EBITDA $29,785 $17,958 $(11,827) Lower PS demand & PS cost pressures Margin 12.3 % 7.2 % (510) bps Lower higher margin COVID PPE sales and inflation Robotics & Digital Solutions 4Q20 4Q21 $ For Quarter Ended 12/26/2020 12/25/2021 Change Comments Revenues $51,596 $59,799 $8,203 Recovery from prior year, increase in the installed base Adjusted EBITDA $12,328 $18,486 $6,158 Strong sales growth and margin expansion Margin 23.9 % 30.9 % 700 bps Driven by favorable mix and pricing actions Canada 4Q20 4Q21 $ For Quarter Ended 12/26/2020 12/25/2021 Change Comments Revenues $34,064 $35,232 $1,168 Recovery from COVID disruptions and foreign exchange rate Adjusted EBITDA $998 $2,168 $1,170 Sales growth Margin 2.9 % 6.2 % 330 bps Higher gross margins from pricing actions & foreign exchange $ Thousands Consolidated 4Q20 4Q21 $ For Quarter Ended 12/26/2020 12/25/2021 Change Comments Revenues $327,069 $344,491 $17,422 Adjusted EBITDA $43,111 $38,612 $(4,499) Margin 13.2 % 11.2 % (200) bps Note: Adjusted EBITDA is a non-GAAP measure. Please see reconciliation of Adjusted EBITDA to Net Income included in this presentation.
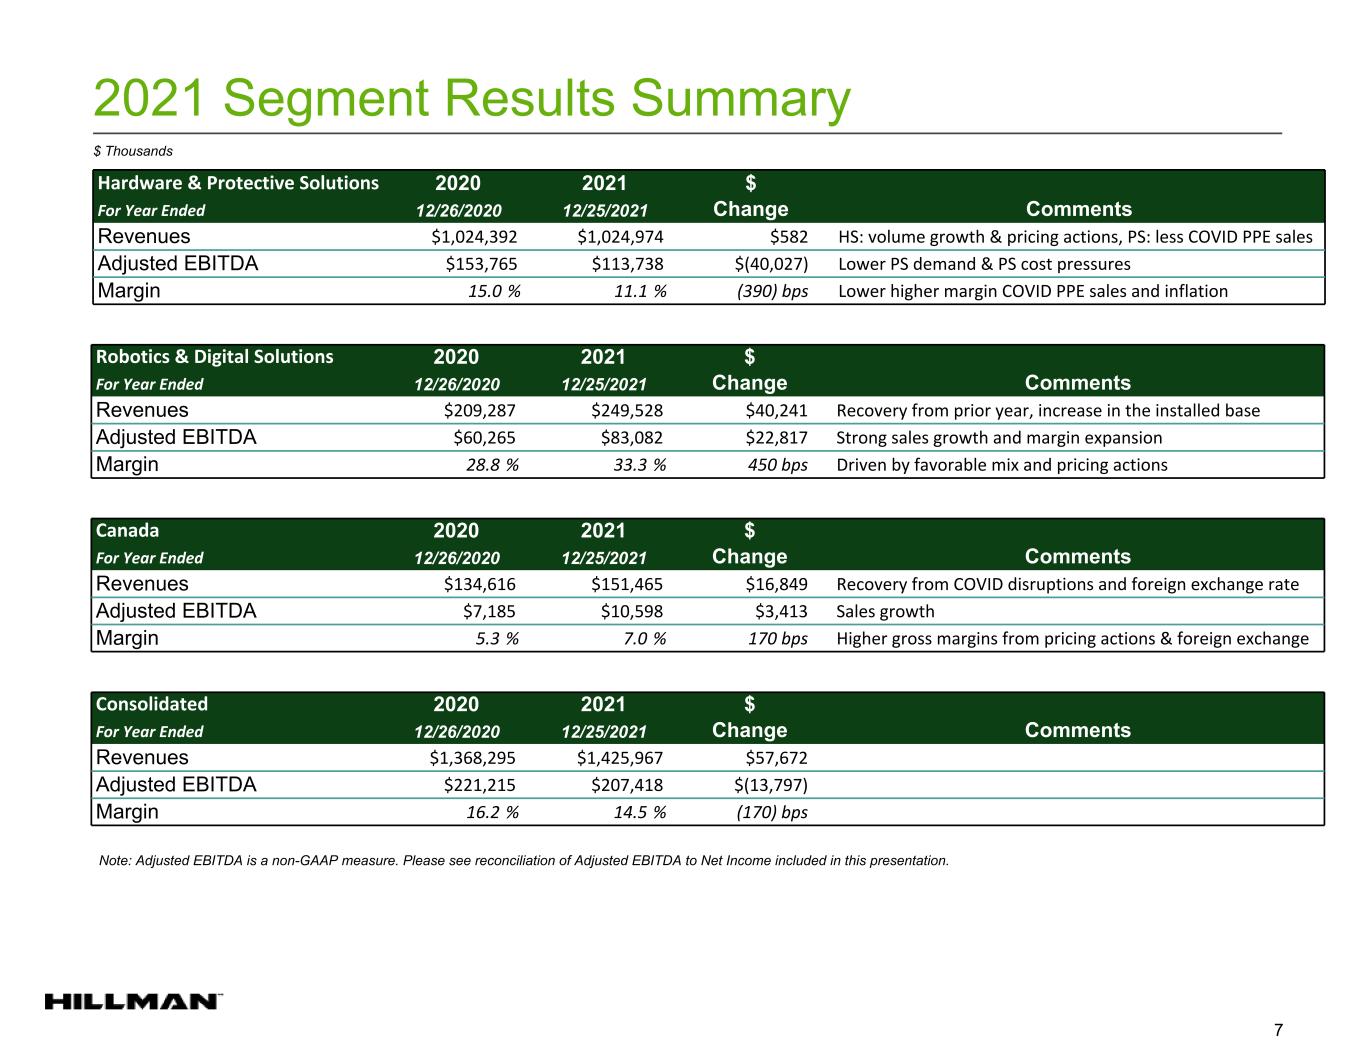
103 176 13 12 63 19 199 204 199 0 0 0 199 199 199 7 2021 Segment Results Summary 7 Hardware & Protective Solutions 2020 2021 $ For Year Ended 12/26/2020 12/25/2021 Change Comments Revenues $1,024,392 $1,024,974 $582 HS: volume growth & pricing actions, PS: less COVID PPE sales Adjusted EBITDA $153,765 $113,738 $(40,027) Lower PS demand & PS cost pressures Margin 15.0 % 11.1 % (390) bps Lower higher margin COVID PPE sales and inflation Robotics & Digital Solutions 2020 2021 $ For Year Ended 12/26/2020 12/25/2021 Change Comments Revenues $209,287 $249,528 $40,241 Recovery from prior year, increase in the installed base Adjusted EBITDA $60,265 $83,082 $22,817 Strong sales growth and margin expansion Margin 28.8 % 33.3 % 450 bps Driven by favorable mix and pricing actions Canada 2020 2021 $ For Year Ended 12/26/2020 12/25/2021 Change Comments Revenues $134,616 $151,465 $16,849 Recovery from COVID disruptions and foreign exchange rate Adjusted EBITDA $7,185 $10,598 $3,413 Sales growth Margin 5.3 % 7.0 % 170 bps Higher gross margins from pricing actions & foreign exchange $ Thousands Consolidated 2020 2021 $ For Year Ended 12/26/2020 12/25/2021 Change Comments Revenues $1,368,295 $1,425,967 $57,672 Adjusted EBITDA $221,215 $207,418 $(13,797) Margin 16.2 % 14.5 % (170) bps Note: Adjusted EBITDA is a non-GAAP measure. Please see reconciliation of Adjusted EBITDA to Net Income included in this presentation.
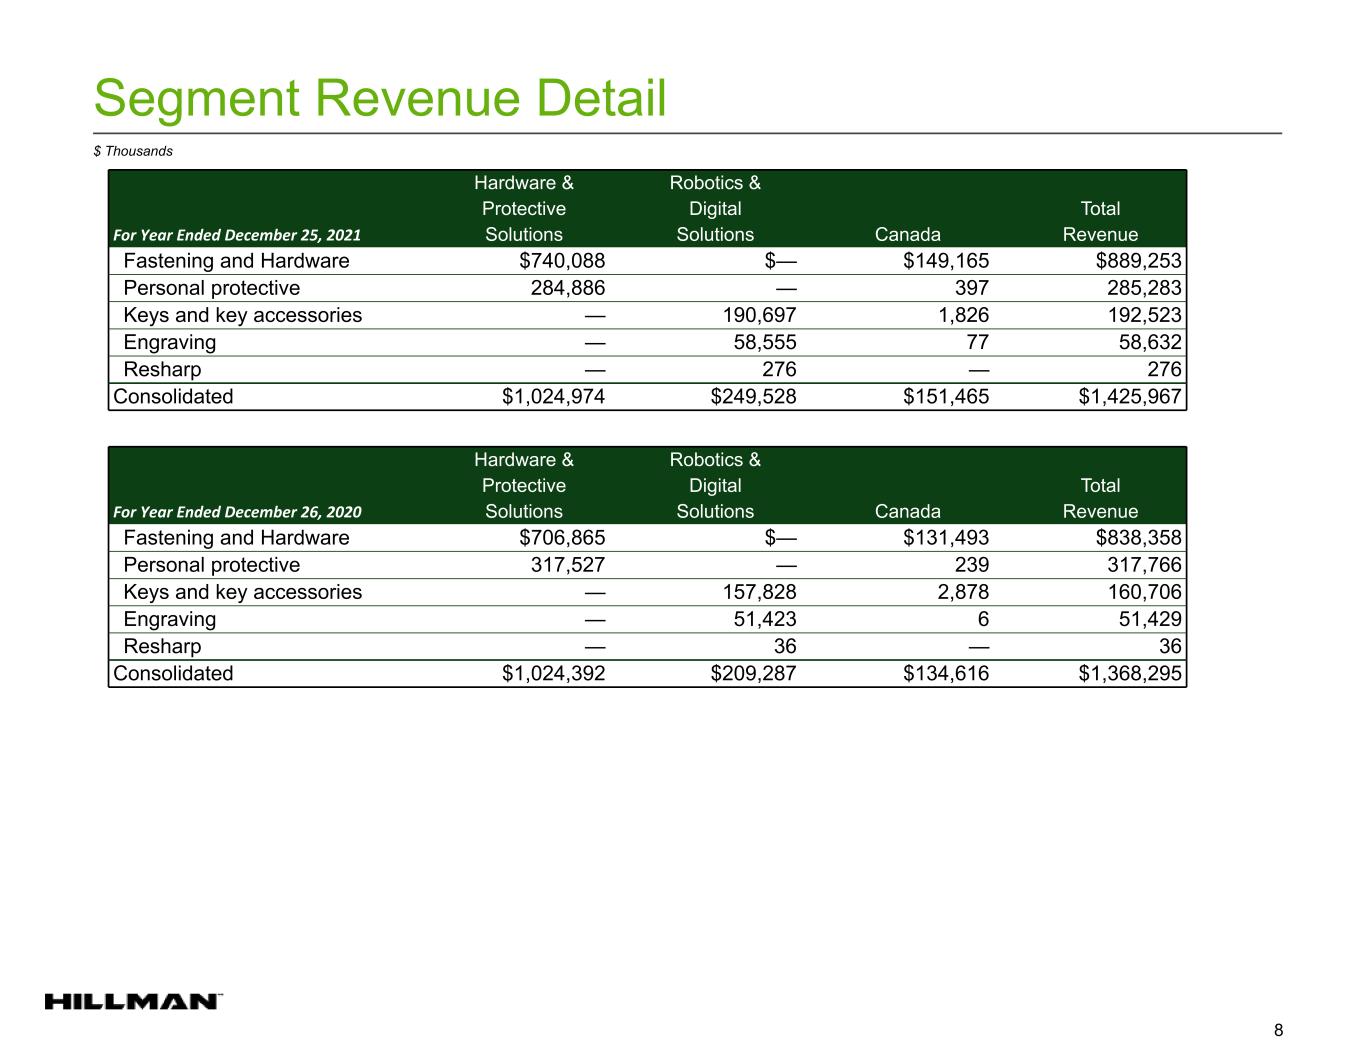
103 176 13 12 63 19 199 204 199 0 0 0 199 199 199 8 Segment Revenue Detail 8 Hardware & Robotics & Protective Digital Total For Year Ended December 25, 2021 Solutions Solutions Canada Revenue Fastening and Hardware $740,088 $— $149,165 $889,253 Personal protective 284,886 — 397 285,283 Keys and key accessories — 190,697 1,826 192,523 Engraving — 58,555 77 58,632 Resharp — 276 — 276 Consolidated $1,024,974 $249,528 $151,465 $1,425,967 $ Thousands Hardware & Robotics & Protective Digital Total For Year Ended December 26, 2020 Solutions Solutions Canada Revenue Fastening and Hardware $706,865 $— $131,493 $838,358 Personal protective 317,527 — 239 317,766 Keys and key accessories — 157,828 2,878 160,706 Engraving — 51,423 6 51,429 Resharp — 36 — 36 Consolidated $1,024,392 $209,287 $134,616 $1,368,295
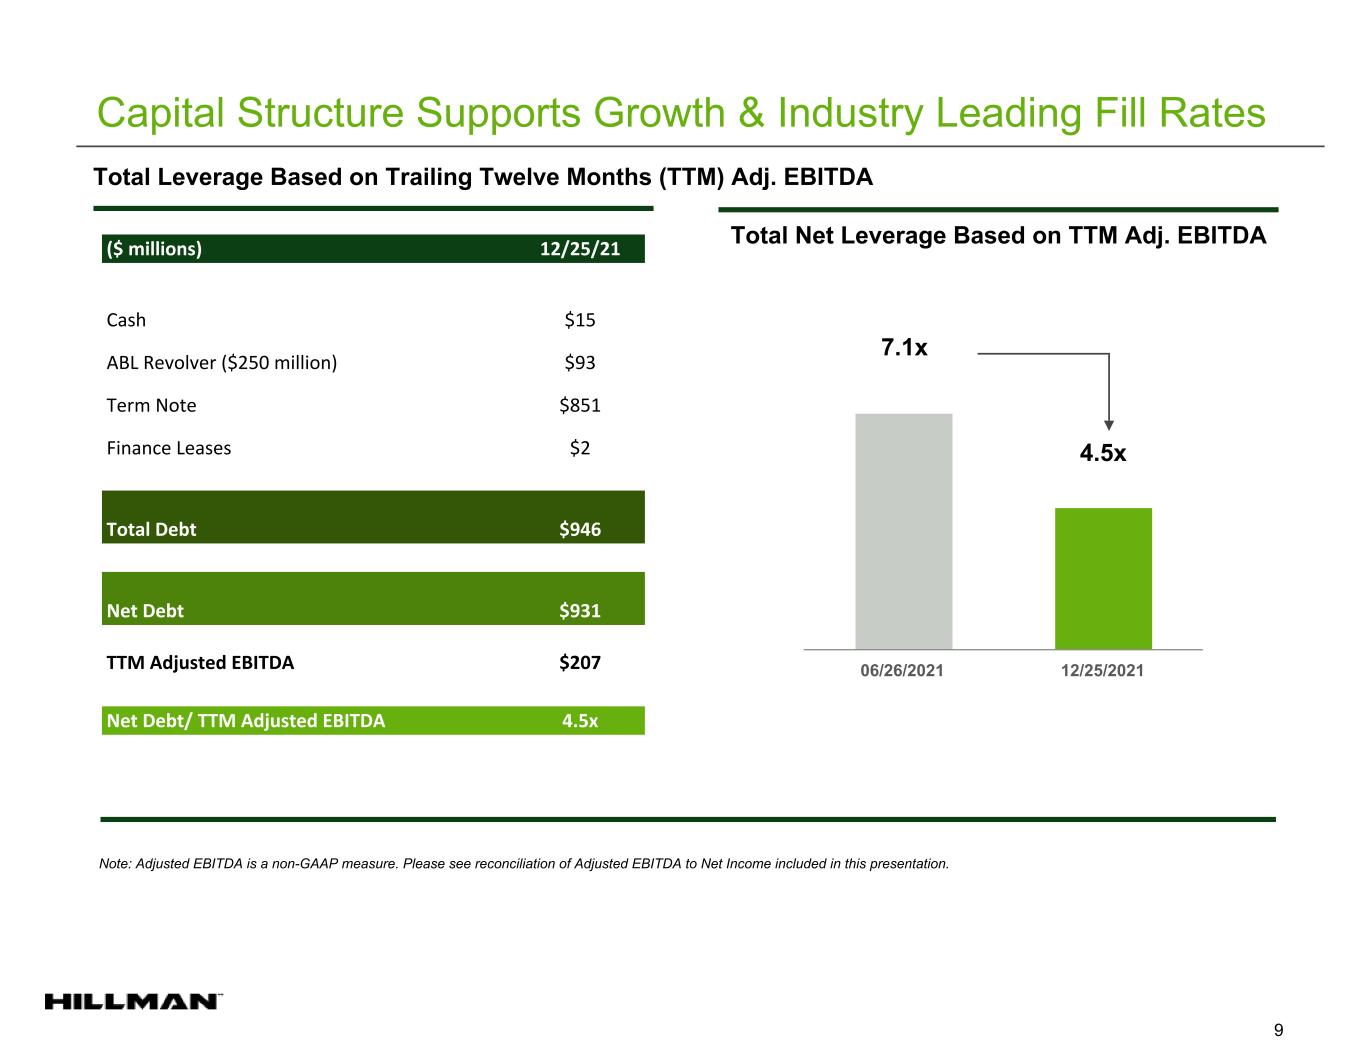
103 176 13 12 63 19 199 204 199 0 0 0 199 199 199 9 Capital Structure Supports Growth & Industry Leading Fill Rates 9 Total Leverage Based on Trailing Twelve Months (TTM) Adj. EBITDA ($ millions) 12/25/21 Cash $15 ABL Revolver ($250 million) $93 Term Note $851 Finance Leases $2 Total Debt $946 Net Debt $931 TTM Adjusted EBITDA $207 Net Debt/ TTM Adjusted EBITDA 4.5x 7.1x 06/26/2021 12/25/2021 4.5x Total Net Leverage Based on TTM Adj. EBITDA Note: Adjusted EBITDA is a non-GAAP measure. Please see reconciliation of Adjusted EBITDA to Net Income included in this presentation.
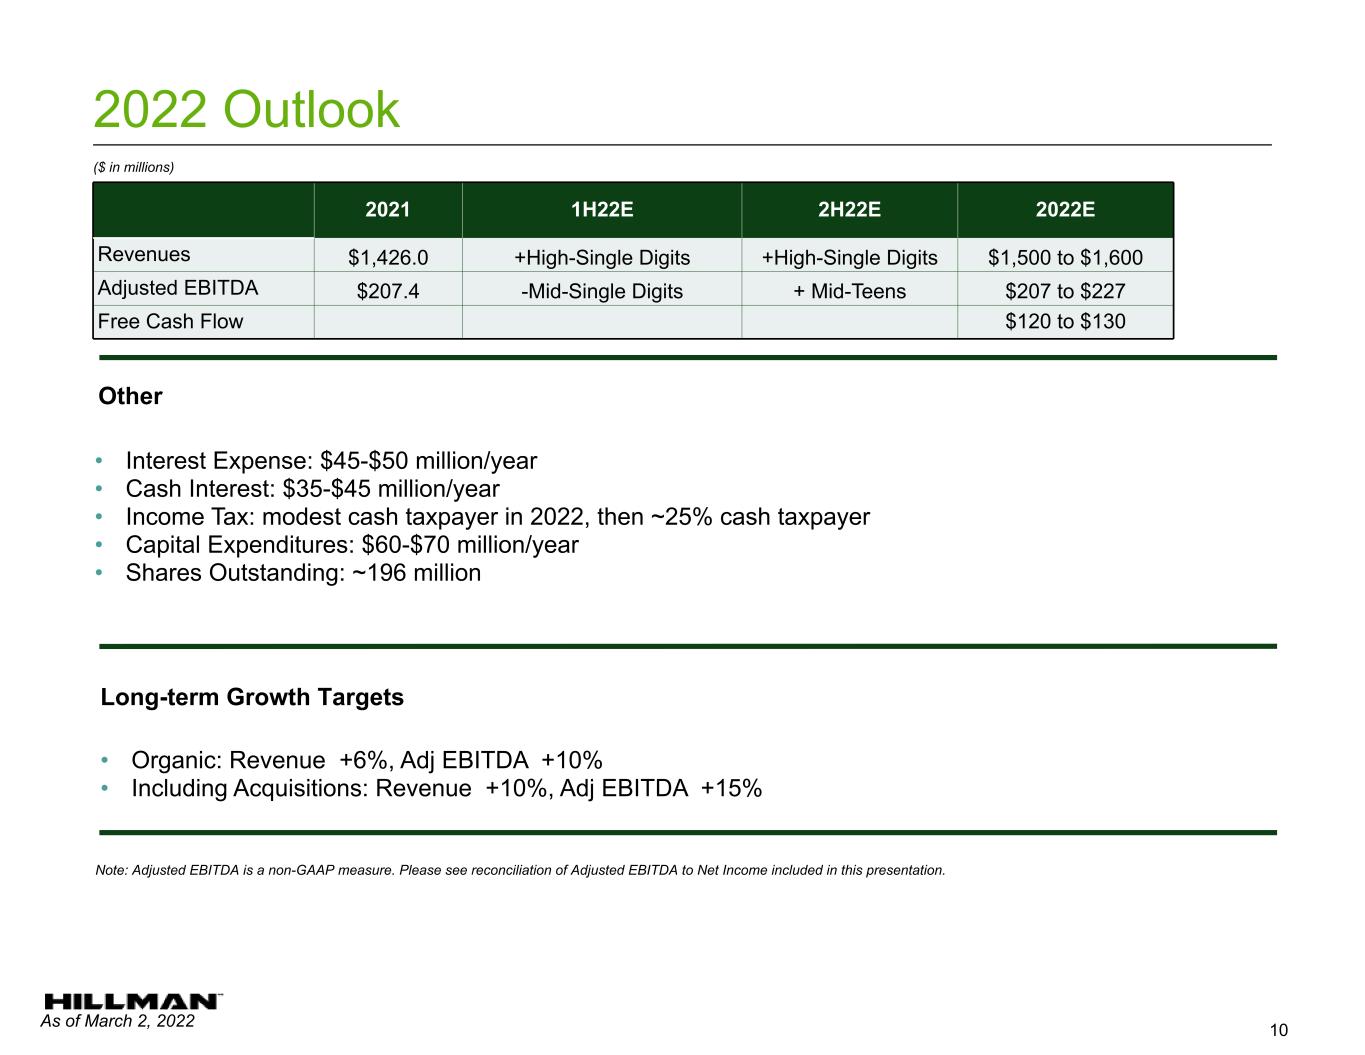
103 176 13 12 63 19 199 204 199 0 0 0 199 199 199 10 2022 Outlook 10 Long-term Growth Targets • Organic: Revenue +6%, Adj EBITDA +10% • Including Acquisitions: Revenue +10%, Adj EBITDA +15% Other • Interest Expense: $45-$50 million/year • Cash Interest: $35-$45 million/year • Income Tax: modest cash taxpayer in 2022, then ~25% cash taxpayer • Capital Expenditures: $60-$70 million/year • Shares Outstanding: ~196 million 2021 1H22E 2H22E 2022E Revenues $1,426.0 +High-Single Digits +High-Single Digits $1,500 to $1,600 Adjusted EBITDA $207.4 -Mid-Single Digits + Mid-Teens $207 to $227 Free Cash Flow $120 to $130 As of March 2, 2022 ($ in millions) Note: Adjusted EBITDA is a non-GAAP measure. Please see reconciliation of Adjusted EBITDA to Net Income included in this presentation.
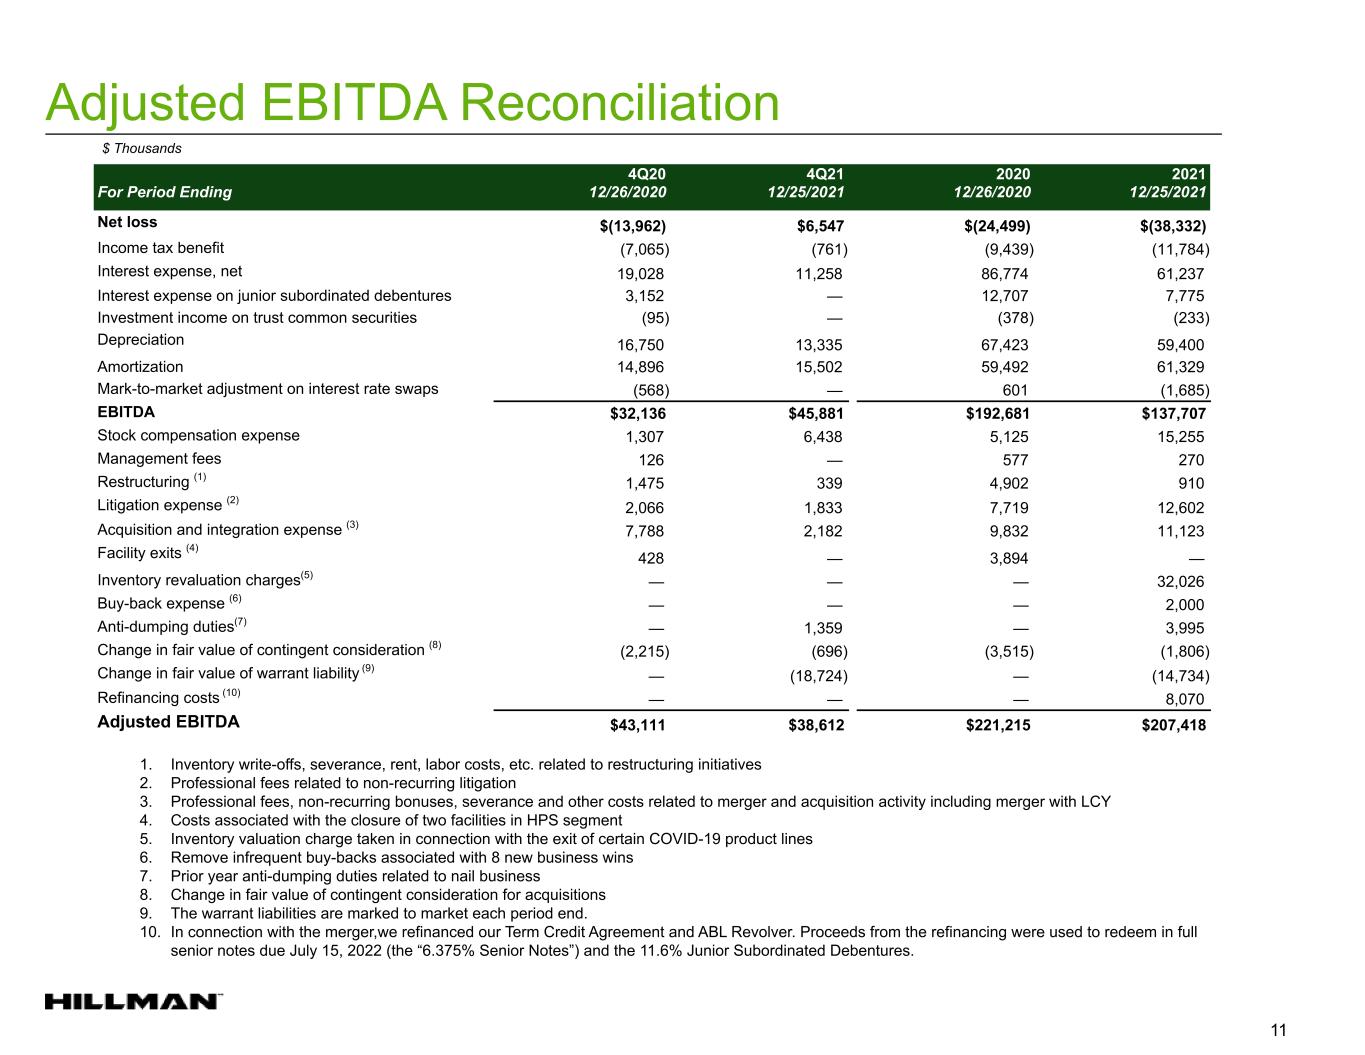
103 176 13 12 63 19 199 204 199 0 0 0 199 199 199 11 Adjusted EBITDA Reconciliation 11 For Period Ending 4Q20 12/26/2020 4Q21 12/25/2021 2020 12/26/2020 2021 12/25/2021 Net loss $(13,962) $6,547 $(24,499) $(38,332) Income tax benefit (7,065) (761) (9,439) (11,784) Interest expense, net 19,028 11,258 86,774 61,237 Interest expense on junior subordinated debentures 3,152 — 12,707 7,775 Investment income on trust common securities (95) — (378) (233) Depreciation 16,750 13,335 67,423 59,400 Amortization 14,896 15,502 59,492 61,329 Mark-to-market adjustment on interest rate swaps (568) — 601 (1,685) EBITDA $32,136 $45,881 $192,681 $137,707 Stock compensation expense 1,307 6,438 5,125 15,255 Management fees 126 — 577 270 Restructuring (1) 1,475 339 4,902 910 Litigation expense (2) 2,066 1,833 7,719 12,602 Acquisition and integration expense (3) 7,788 2,182 9,832 11,123 Facility exits (4) 428 — 3,894 — Inventory revaluation charges(5) — — — 32,026 Buy-back expense (6) — — — 2,000 Anti-dumping duties(7) — 1,359 — 3,995 Change in fair value of contingent consideration (8) (2,215) (696) (3,515) (1,806) Change in fair value of warrant liability (9) — (18,724) — (14,734) Refinancing costs (10) — — — 8,070 Adjusted EBITDA $43,111 $38,612 $221,215 $207,418 $ Thousands 1. Inventory write-offs, severance, rent, labor costs, etc. related to restructuring initiatives 2. Professional fees related to non-recurring litigation 3. Professional fees, non-recurring bonuses, severance and other costs related to merger and acquisition activity including merger with LCY 4. Costs associated with the closure of two facilities in HPS segment 5. Inventory valuation charge taken in connection with the exit of certain COVID-19 product lines 6. Remove infrequent buy-backs associated with 8 new business wins 7. Prior year anti-dumping duties related to nail business 8. Change in fair value of contingent consideration for acquisitions 9. The warrant liabilities are marked to market each period end. 10. In connection with the merger,we refinanced our Term Credit Agreement and ABL Revolver. Proceeds from the refinancing were used to redeem in full senior notes due July 15, 2022 (the “6.375% Senior Notes”) and the 11.6% Junior Subordinated Debentures.
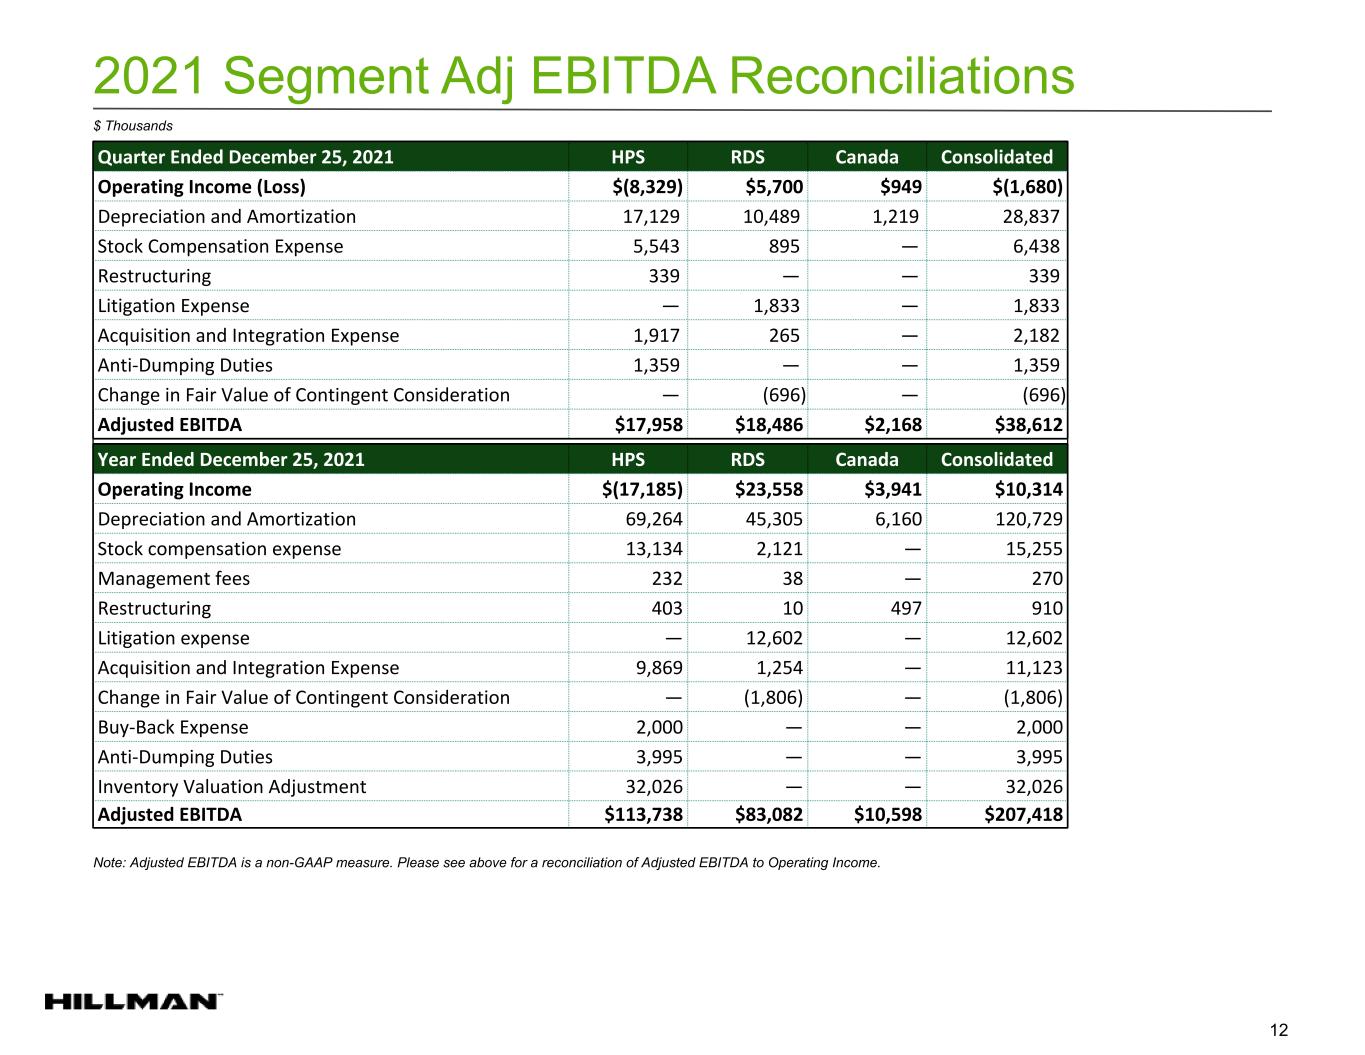
103 176 13 12 63 19 199 204 199 0 0 0 199 199 199 12 2021 Segment Adj EBITDA Reconciliations Note: Adjusted EBITDA is a non-GAAP measure. Please see above for a reconciliation of Adjusted EBITDA to Operating Income. Quarter Ended December 25, 2021 HPS RDS Canada Consolidated Operating Income (Loss) $(8,329) $5,700 $949 $(1,680) Depreciation and Amortization 17,129 10,489 1,219 28,837 Stock Compensation Expense 5,543 895 — 6,438 Restructuring 339 — — 339 Litigation Expense — 1,833 — 1,833 Acquisition and Integration Expense 1,917 265 — 2,182 Anti-Dumping Duties 1,359 — — 1,359 Change in Fair Value of Contingent Consideration — (696) — (696) Adjusted EBITDA $17,958 $18,486 $2,168 $38,612 Year Ended December 25, 2021 HPS RDS Canada Consolidated Operating Income $(17,185) $23,558 $3,941 $10,314 Depreciation and Amortization 69,264 45,305 6,160 120,729 Stock compensation expense 13,134 2,121 — 15,255 Management fees 232 38 — 270 Restructuring 403 10 497 910 Litigation expense — 12,602 — 12,602 Acquisition and Integration Expense 9,869 1,254 — 11,123 Change in Fair Value of Contingent Consideration — (1,806) — (1,806) Buy-Back Expense 2,000 — — 2,000 Anti-Dumping Duties 3,995 — — 3,995 Inventory Valuation Adjustment 32,026 — — 32,026 Adjusted EBITDA $113,738 $83,082 $10,598 $207,418 $ Thousands
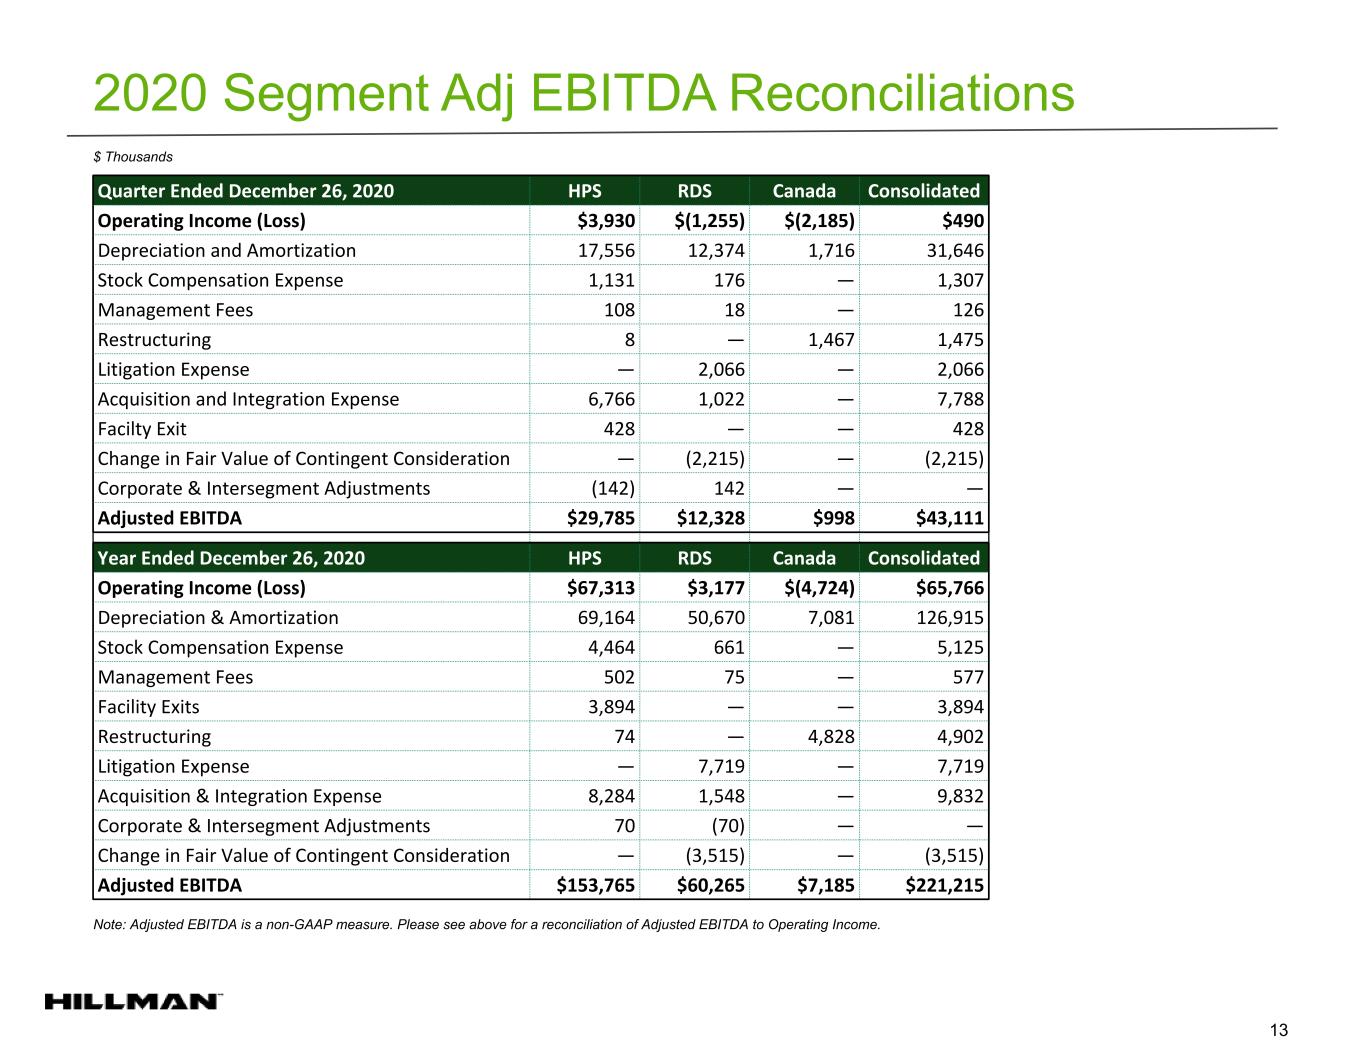
103 176 13 12 63 19 199 204 199 0 0 0 199 199 199 13 2020 Segment Adj EBITDA Reconciliations Note: Adjusted EBITDA is a non-GAAP measure. Please see above for a reconciliation of Adjusted EBITDA to Operating Income. Quarter Ended December 26, 2020 HPS RDS Canada Consolidated Operating Income (Loss) $3,930 $(1,255) $(2,185) $490 Depreciation and Amortization 17,556 12,374 1,716 31,646 Stock Compensation Expense 1,131 176 — 1,307 Management Fees 108 18 — 126 Restructuring 8 — 1,467 1,475 Litigation Expense — 2,066 — 2,066 Acquisition and Integration Expense 6,766 1,022 — 7,788 Facilty Exit 428 — — 428 Change in Fair Value of Contingent Consideration — (2,215) — (2,215) Corporate & Intersegment Adjustments (142) 142 — — Adjusted EBITDA $29,785 $12,328 $998 $43,111 Year Ended December 26, 2020 HPS RDS Canada Consolidated Operating Income (Loss) $67,313 $3,177 $(4,724) $65,766 Depreciation & Amortization 69,164 50,670 7,081 126,915 Stock Compensation Expense 4,464 661 — 5,125 Management Fees 502 75 — 577 Facility Exits 3,894 — — 3,894 Restructuring 74 — 4,828 4,902 Litigation Expense — 7,719 — 7,719 Acquisition & Integration Expense 8,284 1,548 — 9,832 Corporate & Intersegment Adjustments 70 (70) — — Change in Fair Value of Contingent Consideration — (3,515) — (3,515) Adjusted EBITDA $153,765 $60,265 $7,185 $221,215 $ Thousands