EXHIBIT 99.2
Published on July 30, 2021
Exhibit 99.2

Investor Presentation Second Quarter 2021
Safe Harbor Statement Forward Looking Statements 1 This presentation may contain “forward - looking statements” within the meaning of federal securities laws. All statements other t han statements of historical fact included in this presentation are forward - looking statements made in good faith by the company and are intended to qualify for the safe harbor from liability established by the Private Securities Litigation Reform Act of 1995. The Company's actual results may d iff er from their expectations, estimates and projections and consequently, you should not rely on these forward - looking statements as predictions of future events. Words such as "expect," "estimate," "project," "budget," "forecast," "anticipate," "intend," "plan," "may," "will," "could," "sh ould," "believes," "predicts," "potential," "continue," and similar expressions are intended to identify such forward - looking statements. These forward - looking statements include, without limitation, the Company’s expectations with respect to future performance. These forward - looking statements involve sign ificant risks and uncertainties that could cause the actual results to differ materially from the expected results. Most of these factors are o uts ide the Company's control and are difficult to predict. Factors that may cause such differences include, but are not limited to: (1) unfavorable econom ic conditions that may affect operations, financial condition and cash flows including inflation, recessions, instability in the financial markets or credi t m arkets; (2) highly competitive markets that could adversely impact financial results (3) ability to continue to innovate with new products and services; (4) se asonality; (5) large customer concentration; (6) ability to recruit and retain qualified employees; (7) the outcome of any legal proceedings that may be instituted against the Company (8) adverse changes in currency exchange rates; (9) the impact of COVID - 19 on the Company’s business; or (10) regula tory changes and potential legislation that could adversely impact financial results. The foregoing list of factors is not exclusive, and rea ders should also refer to those risks that will be included under the header “Risk Factors” set forth in Item 1A of the company’s annual report filed o n F orm 10 - K. Given these uncertainties, current or prospective investors are cautioned not to place undue reliance on any such forward looking stateme nts . The Company does not undertake or accept any obligation or undertaking to release publicly any updates or revisions to any forward - looking statem ents in this presentation to reflect any change in its expectations or any change in events, conditions or circumstances on which any such st atement is based. All estimates of financial metrics in this presentation for fiscal 2021 and beyond are current as of July 29, 2021. Presentation of Non - GAAP Financial Measures In addition to the results provided in accordance with U.S. generally accepted accounting principles (“GAAP”) throughout this pr esentation the company has provided non - GAAP financial measures, which present results on a basis adjusted for certain items. The company uses these non - GAAP financial measures for business planning purposes and in measuring its performance relative to that of its competitors. The company believes that these non - GAAP financial measures are useful financial metrics to assess its operating performance from period - to - period by excluding certain items that the company believes are not representative of its core business. These non - GAAP financial measures are not intended to replace, and should not be considered superior to, the presentation of the company’s financial results in accordance with GAAP. The use of th e non - GAAP financial measures terms may differ from similar measures reported by other companies and may not be comparable to other similarly titl ed measures. These non - GAAP financial measures are reconciled from the respective measures under GAAP in the appendix below. The company is not able to provide a reconciliation of the company’s non - GAAP financial guidance to the corresponding GAAP measu res without unreasonable effort because of the inherent difficulty in forecasting and quantifying certain amounts necessary for such a re con ciliation such as certain non - cash, nonrecurring or other items that are included in net income and EBITDA as well as the related tax impacts of t hese items and asset dispositions / acquisitions and changes in foreign currency exchange rates that are included in cash flow, due to the uncerta int y and variability of the nature and amount of these future charges and costs.

2Q21 Review
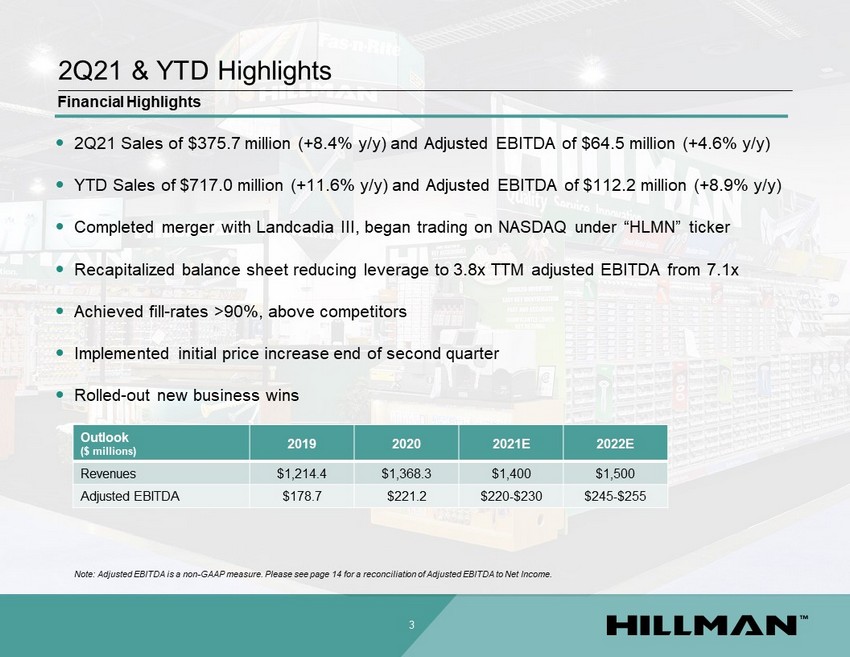
2Q21 & YTD Highlights 3 2Q21 Sales of $375.7 million (+8.4% y/y) and Adjusted EBITDA of $64.5 million (+4.6% y/y) YTD Sales of $717.0 million (+11.6% y/y) and Adjusted EBITDA of $112.2 million (+8.9% y/y) Completed merger with Landcadia III, began trading on NASDAQ under “HLMN” ticker Recapitalized balance sheet reducing leverage to 3.8x TTM adjusted EBITDA from 7.1x Achieved fill - rates >90%, above competitors Implemented initial price increase end of second quarter Rolled - out new business wins Financial Highlights Outlook ($ millions) 2019 2020 2021E 2022E Revenues $1,214.4 $1,368.3 $1,400 $1,500 Adjusted EBITDA $178.7 $221.2 $220 - $230 $245 - $255 Note: Adjusted EBITDA is a non - GAAP measure. Please see page 14 for a reconciliation of Adjusted EBITDA to Net Income.
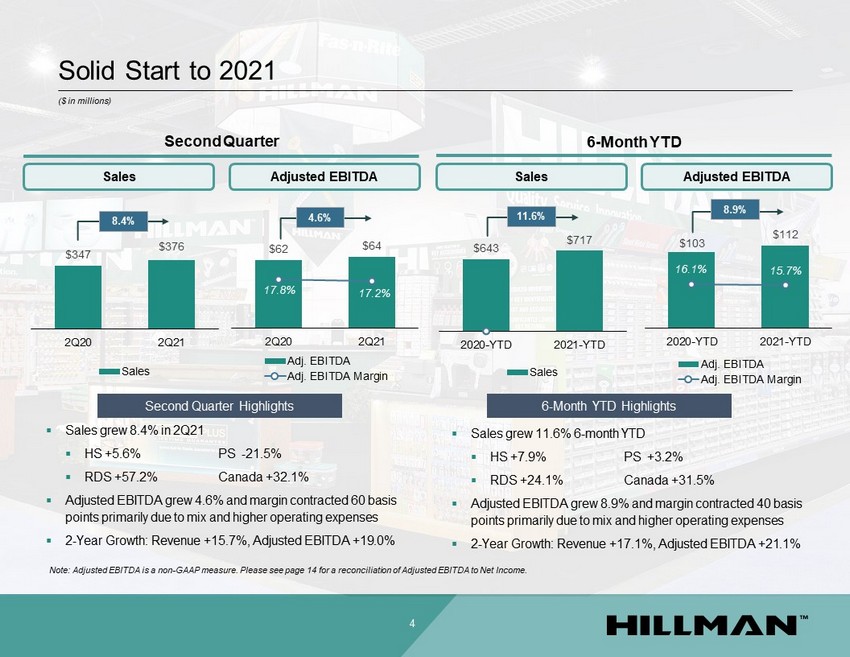
Solid Start to 2021 4 Second Quarter 6 - Month YTD 8.4 % $347 $376 2Q20 2Q21 Sales $62 $64 17.8% 17.2% 2Q20 2Q21 Adj. EBITDA Adj. EBITDA Margin 4.6 % 11.6% $643 $717 2020-YTD 2021-YTD Sales $103 $112 16.1% 15.7% 2020-YTD 2021-YTD Adj. EBITDA Adj. EBITDA Margin 8.9 % Sales Adjusted EBITDA Sales Adjusted EBITDA ▪ Sales grew 8.4% in 2Q21 ▪ HS +5.6% PS - 21.5% ▪ RDS +57.2% Canada +32.1% ▪ Adjusted EBITDA grew 4.6% and margin contracted 60 basis points primarily due to mix and higher operating expenses ▪ 2 - Year Growth: Revenue +15.7%, Adjusted EBITDA +19.0% ($ in millions) Note: Adjusted EBITDA is a non - GAAP measure. Please see page 14 for a reconciliation of Adjusted EBITDA to Net Income. ▪ Sales grew 11.6% 6 - month YTD ▪ HS +7.9% PS +3.2% ▪ RDS +24.1% Canada +31.5% ▪ Adjusted EBITDA grew 8.9% and margin contracted 40 basis points primarily due to mix and higher operating expenses ▪ 2 - Year Growth: Revenue +17.1%, Adjusted EBITDA +21.1% Second Quarter Highlights 6 - Month YTD Highlights
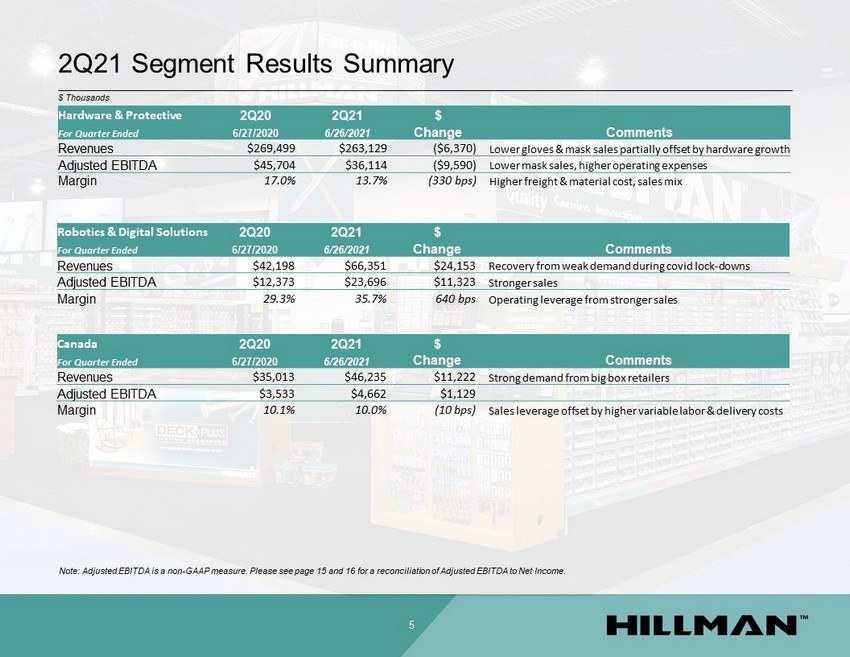
2Q21 Segment Results Summary 5 Hardware & Protective 2Q20 2Q21 $ For Quarter Ended 6/27/2020 6/26/2021 Change Comments Revenues $269,499 $263,129 ($6,370) Lower gloves & mask sales partially offset by hardware growth Adjusted EBITDA $45,704 $36,114 ($9,590) Lower mask sales, higher operating expenses Margin 17.0% 13.7% (330 bps) Higher freight & material cost, sales mix Robotics & Digital Solutions 2Q20 2Q21 $ For Quarter Ended 6/27/2020 6/26/2021 Change Comments Revenues $42,198 $66,351 $24,153 Recovery from weak demand during covid lock - downs Adjusted EBITDA $12,373 $23,696 $11,323 Stronger sales Margin 29.3% 35.7% 640 bps Operating leverage from stronger sales Canada 2Q20 2Q21 $ For Quarter Ended 6/27/2020 6/26/2021 Change Comments Revenues $35,013 $46,235 $11,222 Strong demand from big box retailers Adjusted EBITDA $3,533 $4,662 $1,129 Margin 10.1% 10.0% (10 bps) Sales leverage offset by higher variable labor & delivery costs Note: Adjusted EBITDA is a non - GAAP measure. Please see page 15 and 16 for a reconciliation of Adjusted EBITDA to Net Income. $ Thousands
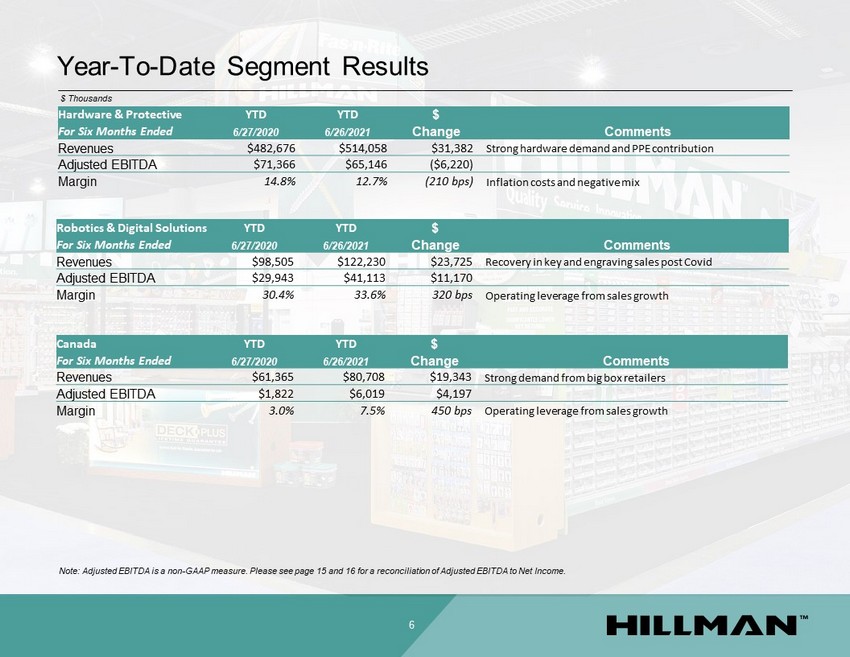
Year - To - Date Segment Results 6 Robotics & Digital Solutions YTD YTD $ For Six Months Ended 6/27/2020 6/26/2021 Change Comments Revenues $98,505 $122,230 $23,725 Recovery in key and engraving sales post Covid Adjusted EBITDA $29,943 $41,113 $11,170 Margin 30.4% 33.6% 320 bps Operating leverage from sales growth Hardware & Protective YTD YTD $ For Six Months Ended 6/27/2020 6/26/2021 Change Comments Revenues $482,676 $514,058 $31,382 Strong hardware demand and PPE contribution Adjusted EBITDA $71,366 $65,146 ($6,220) Margin 14.8% 12.7% (210 bps) Inflation costs and negative mix Canada YTD YTD $ For Six Months Ended 6/27/2020 6/26/2021 Change Comments Revenues $61,365 $80,708 $19,343 Strong demand from big box retailers Adjusted EBITDA $1,822 $6,019 $4,197 Margin 3.0% 7.5% 450 bps Operating leverage from sales growth Note: Adjusted EBITDA is a non - GAAP measure. Please see page 15 and 16 for a reconciliation of Adjusted EBITDA to Net Income. $ Thousands
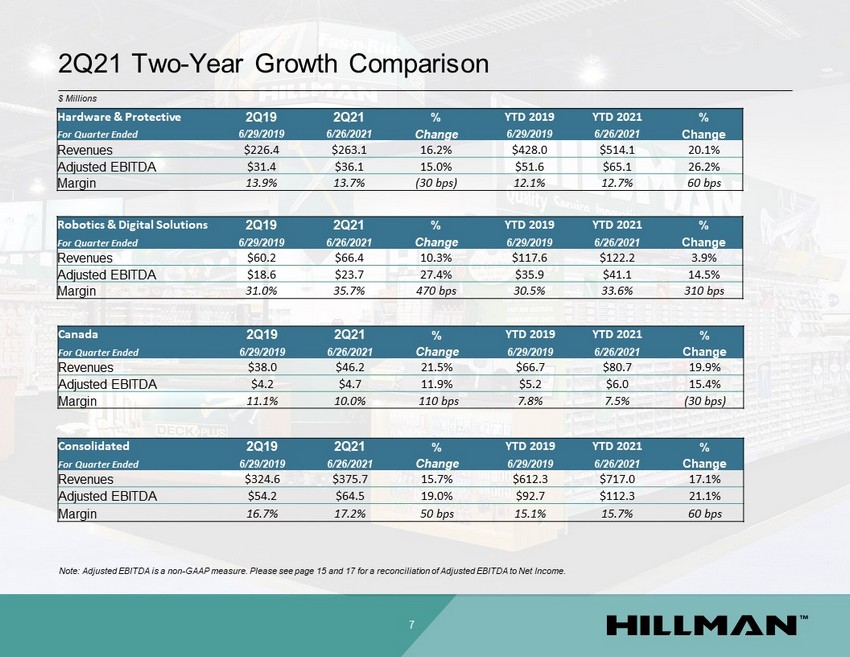
2Q21 Two - Year Growth Comparison 7 Hardware & Protective 2Q19 2Q21 % YTD 2019 YTD 2021 % For Quarter Ended 6/29/2019 6/26/2021 Change 6/29/2019 6/26/2021 Change Revenues $226.4 $263.1 16.2% $428.0 $514.1 20.1% Adjusted EBITDA $31.4 $36.1 15.0% $51.6 $65.1 26.2% Margin 13.9% 13.7% (30 bps) 12.1% 12.7% 60 bps $ Millions Note: Adjusted EBITDA is a non - GAAP measure. Please see page 15 and 17 for a reconciliation of Adjusted EBITDA to Net Income. Robotics & Digital Solutions 2Q19 2Q21 % YTD 2019 YTD 2021 % For Quarter Ended 6/29/2019 6/26/2021 Change 6/29/2019 6/26/2021 Change Revenues $60.2 $66.4 10.3% $117.6 $122.2 3.9% Adjusted EBITDA $18.6 $23.7 27.4% $35.9 $41.1 14.5% Margin 31.0% 35.7% 470 bps 30.5% 33.6% 310 bps Canada 2Q19 2Q21 % YTD 2019 YTD 2021 % For Quarter Ended 6/29/2019 6/26/2021 Change 6/29/2019 6/26/2021 Change Revenues $38.0 $46.2 21.5% $66.7 $80.7 19.9% Adjusted EBITDA $4.2 $4.7 11.9% $5.2 $6.0 15.4% Margin 11.1% 10.0% 110 bps 7.8% 7.5% (30 bps) Consolidated 2Q19 2Q21 % YTD 2019 YTD 2021 % For Quarter Ended 6/29/2019 6/26/2021 Change 6/29/2019 6/26/2021 Change Revenues $324.6 $375.7 15.7% $612.3 $717.0 17.1% Adjusted EBITDA $54.2 $64.5 19.0% $92.7 $112.3 21.1% Margin 16.7% 17.2% 50 bps 15.1% 15.7% 60 bps
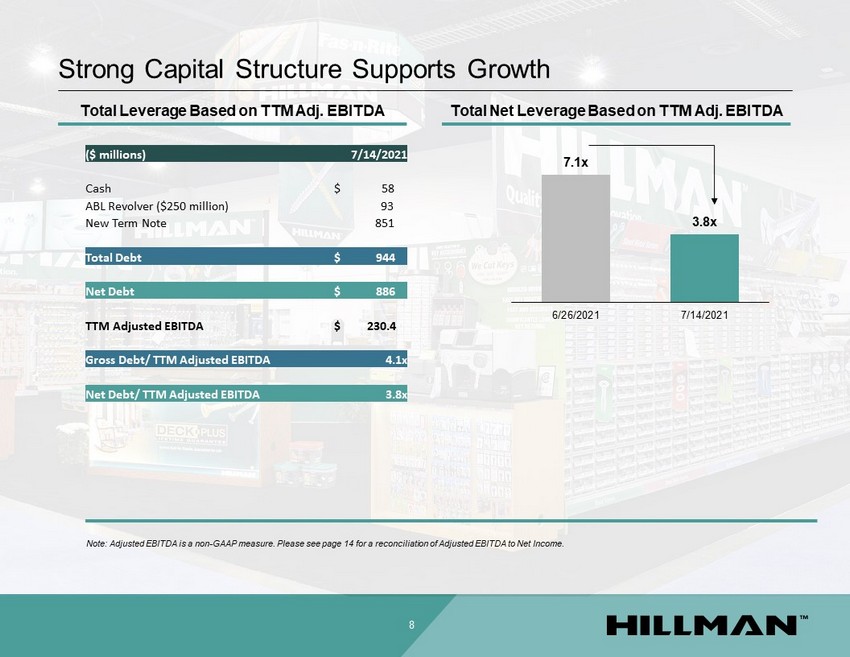
Strong Capital Structure Supports Growth 8 Total Net Leverage Based on TTM Adj. EBITDA 7.1x 3.8x 6/26/2021 7/14/2021 Total Leverage Based on TTM Adj. EBITDA Note: Adjusted EBITDA is a non - GAAP measure. Please see page 14 for a reconciliation of Adjusted EBITDA to Net Income. ($ millions) 7/14/2021 Cash $ 58 ABL Revolver ($250 million) 93 New Term Note 851 Total Debt $ 944 Net Debt $ 886 TTM Adjusted EBITDA $ 230.4 Gross Debt/ TTM Adjusted EBITDA 4.1x Net Debt/ TTM Adjusted EBITDA 3.8x
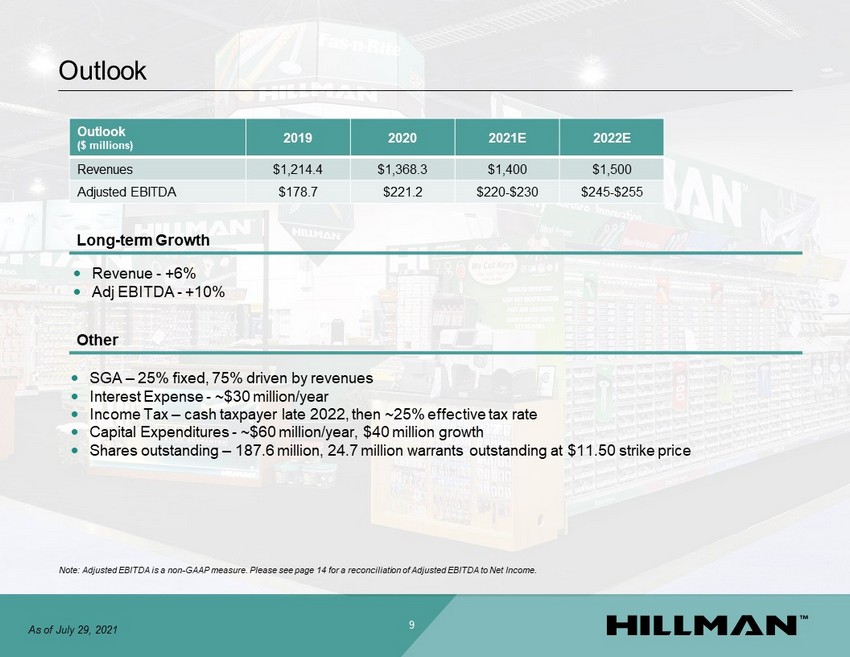
Outlook 9 Long - term Growth Revenue - +6% Adj EBITDA - +10% Other SGA – 25% fixed, 75% driven by revenues Interest Expense - ~$30 million/year Income Tax – cash taxpayer late 2022, then ~25% effective tax rate Capital Expenditures - ~$60 million/year, $40 million growth Shares outstanding – 187.6 million, 24.7 million warrants outstanding at $11.50 strike price Note: Adjusted EBITDA is a non - GAAP measure. Please see page 14 for a reconciliation of Adjusted EBITDA to Net Income. Outlook ($ millions) 2019 2020 2021E 2022E Revenues $1,214.4 $1,368.3 $1,400 $1,500 Adjusted EBITDA $178.7 $221.2 $220 - $230 $245 - $255 As of July 29, 2021

Appendix
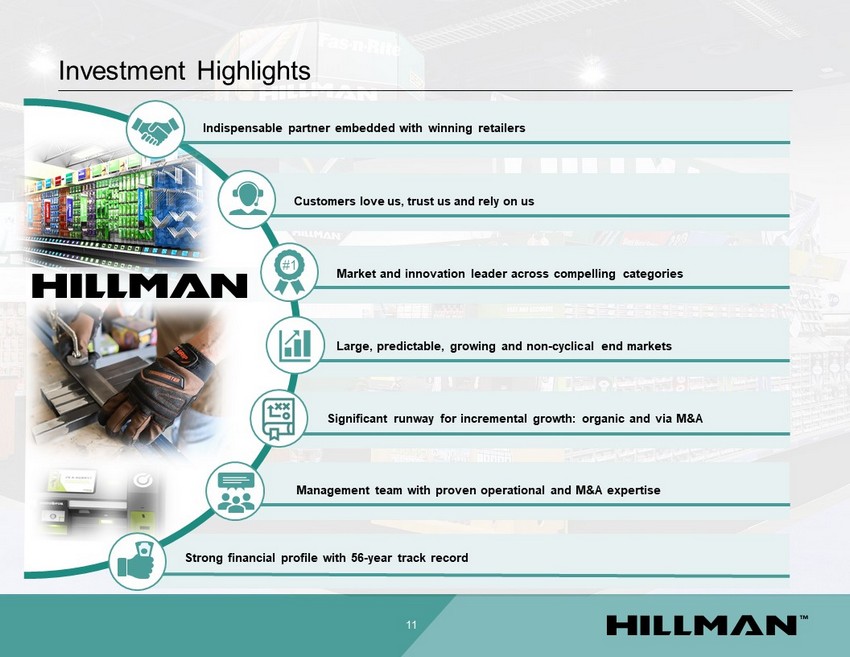
Significant runway for incremental growth: organic and via M&A Management team with proven operational and M&A expertise Strong financial profile with 56 - year track record Market and innovation leader across compelling categories Indispensable partner embedded with winning retailers Customers love us, trust us and rely on us Large, predictable, growing and non - cyclical end markets Investment Highlights 11 #1
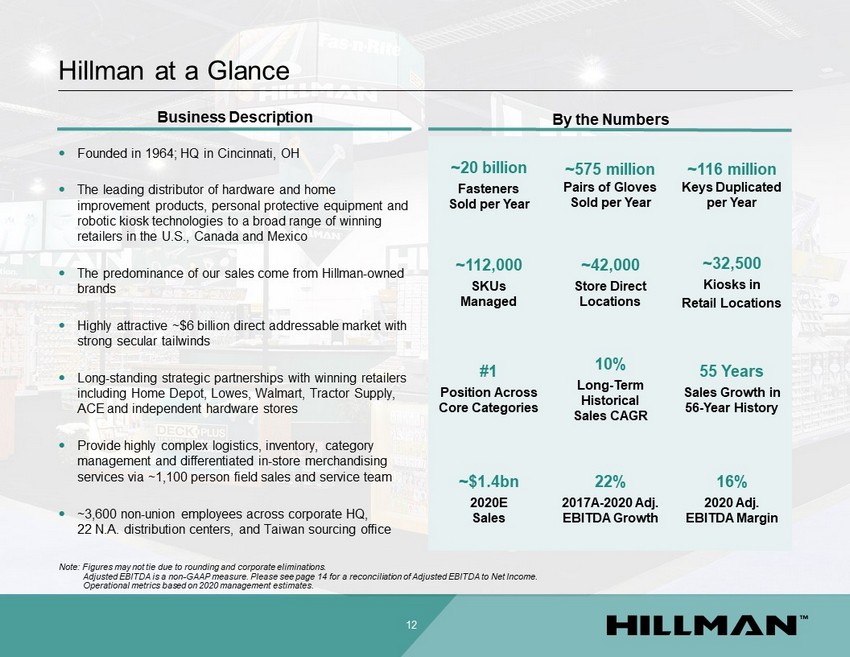
Hillman at a Glance 12 Founded in 1964; HQ in Cincinnati, OH The leading distributor of hardware and home improvement products, personal protective equipment and robotic kiosk technologies to a broad range of winning retailers in the U.S., Canada and Mexico The predominance of our sales come from Hillman - owned brands Highly attractive ~$6 billion direct addressable market with strong secular tailwinds Long - standing strategic partnerships with winning retailers including Home Depot, Lowes, Walmart, Tractor Supply, ACE and independent hardware stores Provide highly complex logistics, inventory, category management and differentiated in - store merchandising services via ~1,100 person field sales and service team ~3,600 non - union employees across corporate HQ, 22 N.A. distribution centers, and Taiwan sourcing office Note: Figures may not tie due to rounding and corporate eliminations. Adjusted EBITDA is a non - GAAP measure. Please see page 14 for a reconciliation of Adjusted EBITDA to Net Income. Operational metrics based on 2020 management estimates. By the Numbers ~20 billion Fasteners Sold per Year ~575 million Pairs of Gloves Sold per Year ~116 million Keys Duplicated per Year ~112,000 SKUs Managed ~42,000 Store Direct Locations ~32,500 Kiosks in Retail Locations #1 Position Across Core Categories 10% Long - Term Historical Sales CAGR 55 Years Sales Growth in 56 - Year History ~$1.4bn 2020E Sales 22% 2017A - 2020 Adj. EBITDA Growth 16% 2020 Adj. EBITDA Margin Business Description
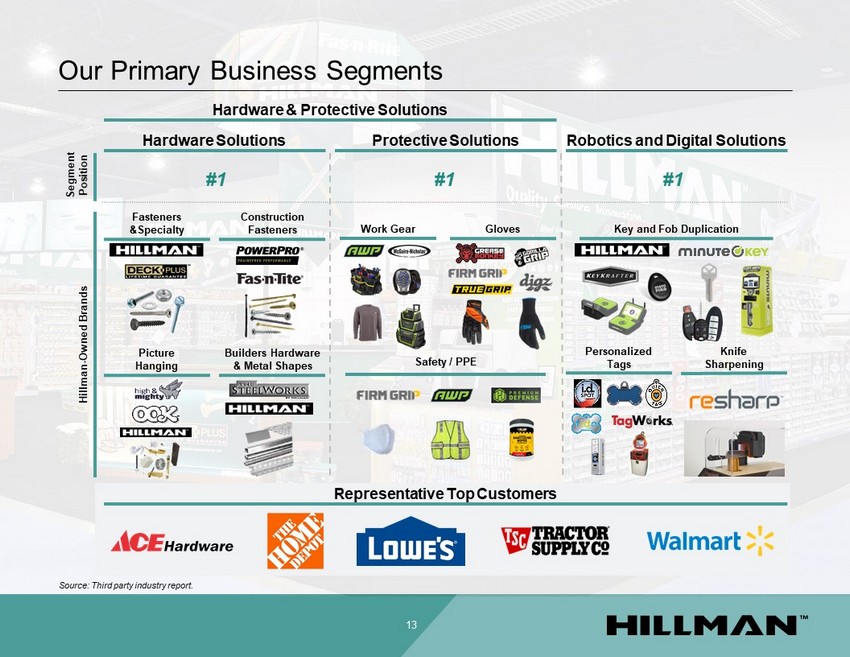
13 Segment Position #1 #1 #1 Hardware Solutions Protective Solutions Robotics and Digital Solutions Our Primary Business Segments Key and Fob Duplication Personalized Tags Knife Sharpening Fasteners &Specialty Gloves Builders Hardware & Metal Shapes Safety / PPE Construction Fasteners Work Gear Picture Hanging Source: Third party industry report. Hardware & Protective Solutions Hillman - Owned Brands Representative Top Customers
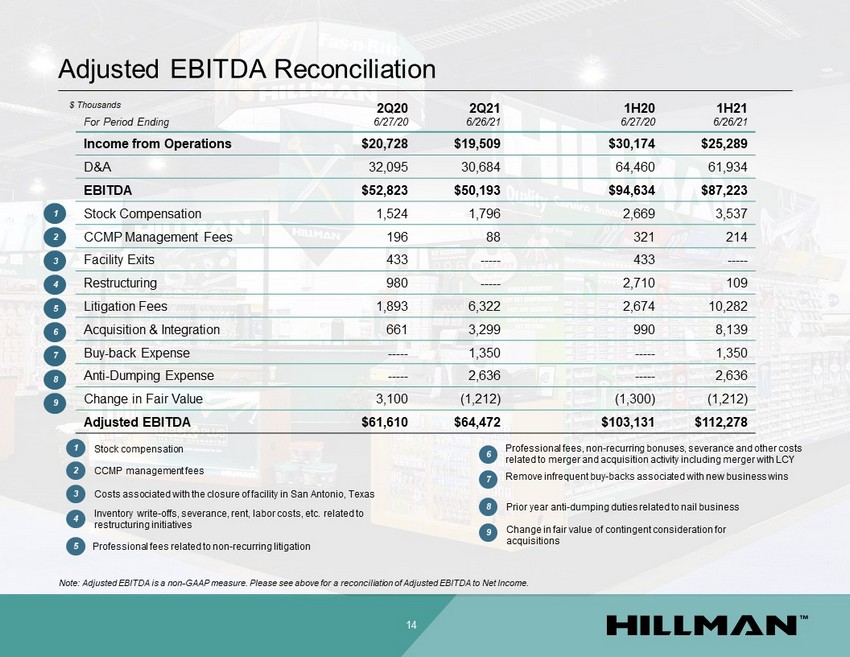
Adjusted EBITDA Reconciliation 14 1 2 3 4 5 7 6 8 9 1 Stock compensation 2 CCMP management fees 3 Costs associated with the closure of facility in San Antonio, Texas 4 Inventory write - offs, severance, rent, labor costs, etc. related to restructuring initiatives 5 Professional fees related to non - recurring litigation 6 Professional fees, non - recurring bonuses, severance and other costs related to merger and acquisition activity including merger with LCY 7 Remove infrequent buy - backs associated with new business wins 8 Prior year anti - dumping duties related to nail business 9 Change in fair value of contingent consideration for acquisitions For Period Ending 2Q20 6/27/20 2Q21 6/26/21 1H20 6/27/20 1H21 6/26/21 Income from Operations $20,728 $19,509 $30,174 $25,289 D&A 32,095 30,684 64,460 61,934 EBITDA $52,823 $50,193 $94,634 $87,223 Stock Compensation 1,524 1,796 2,669 3,537 CCMP Management Fees 196 88 321 214 Facility Exits 433 ----- 433 ----- Restructuring 980 ----- 2,710 109 Litigation Fees 1,893 6,322 2,674 10,282 Acquisition & Integration 661 3,299 990 8,139 Buy - back Expense ----- 1,350 ----- 1,350 Anti - Dumping Expense ----- 2,636 ----- 2,636 Change in Fair Value 3,100 (1,212) (1,300) (1,212) Adjusted EBITDA $61,610 $64,472 $103,131 $112,278 $ Thousands Note: Adjusted EBITDA is a non - GAAP measure. Please see above for a reconciliation of Adjusted EBITDA to Net Income.
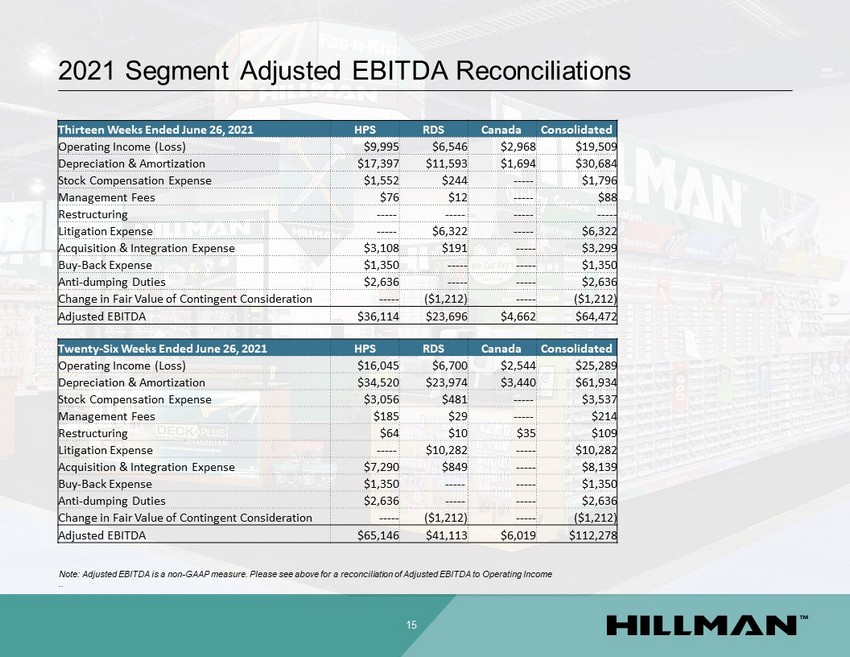
2021 Segment Adjusted EBITDA Reconciliations 15 Note: Adjusted EBITDA is a non - GAAP measure. Please see above for a reconciliation of Adjusted EBITDA to Operating Income .. Thirteen Weeks Ended June 26, 2021 HPS RDS Canada Consolidated Operating Income (Loss) $9,995 $6,546 $2,968 $19,509 Depreciation & Amortization $17,397 $11,593 $1,694 $30,684 Stock Compensation Expense $1,552 $244 ----- $1,796 Management Fees $76 $12 ----- $88 Restructuring ----- ----- ----- ----- Litigation Expense ----- $6,322 ----- $6,322 Acquisition & Integration Expense $3,108 $191 ----- $3,299 Buy - Back Expense $1,350 ----- ----- $1,350 Anti - dumping Duties $2,636 ----- ----- $2,636 Change in Fair Value of Contingent Consideration ----- ($1,212) ----- ($1,212) Adjusted EBITDA $36,114 $23,696 $4,662 $64,472 Twenty - Six Weeks Ended June 26, 2021 HPS RDS Canada Consolidated Operating Income (Loss) $16,045 $6,700 $2,544 $25,289 Depreciation & Amortization $34,520 $23,974 $3,440 $61,934 Stock Compensation Expense $3,056 $481 ----- $3,537 Management Fees $185 $29 ----- $214 Restructuring $64 $10 $35 $109 Litigation Expense ----- $10,282 ----- $10,282 Acquisition & Integration Expense $7,290 $849 ----- $8,139 Buy - Back Expense $1,350 ----- ----- $1,350 Anti - dumping Duties $2,636 ----- ----- $2,636 Change in Fair Value of Contingent Consideration ----- ($1,212) ----- ($1,212) Adjusted EBITDA $65,146 $41,113 $6,019 $112,278
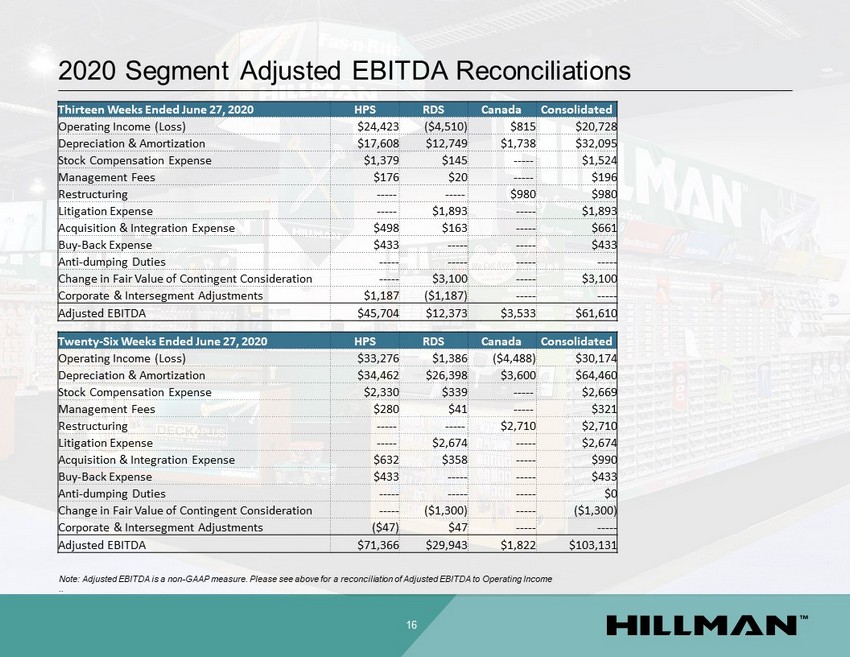
2020 Segment Adjusted EBITDA Reconciliations 16 Note: Adjusted EBITDA is a non - GAAP measure. Please see above for a reconciliation of Adjusted EBITDA to Operating Income .. Thirteen Weeks Ended June 27, 2020 HPS RDS Canada Consolidated Operating Income (Loss) $24,423 ($4,510) $815 $20,728 Depreciation & Amortization $17,608 $12,749 $1,738 $32,095 Stock Compensation Expense $1,379 $145 ----- $1,524 Management Fees $176 $20 ----- $196 Restructuring ----- ----- $980 $980 Litigation Expense ----- $1,893 ----- $1,893 Acquisition & Integration Expense $498 $163 ----- $661 Buy - Back Expense $433 ----- ----- $433 Anti - dumping Duties ----- ----- ----- ----- Change in Fair Value of Contingent Consideration ----- $3,100 ----- $3,100 Corporate & Intersegment Adjustments $1,187 ($1,187) ----- ----- Adjusted EBITDA $45,704 $12,373 $3,533 $61,610 Twenty - Six Weeks Ended June 27, 2020 HPS RDS Canada Consolidated Operating Income (Loss) $33,276 $1,386 ($4,488) $30,174 Depreciation & Amortization $34,462 $26,398 $3,600 $64,460 Stock Compensation Expense $2,330 $339 ----- $2,669 Management Fees $280 $41 ----- $321 Restructuring ----- ----- $2,710 $2,710 Litigation Expense ----- $2,674 ----- $2,674 Acquisition & Integration Expense $632 $358 ----- $990 Buy - Back Expense $433 ----- ----- $433 Anti - dumping Duties ----- ----- ----- $0 Change in Fair Value of Contingent Consideration ----- ($1,300) ----- ($1,300) Corporate & Intersegment Adjustments ($47) $47 ----- ----- Adjusted EBITDA $71,366 $29,943 $1,822 $103,131
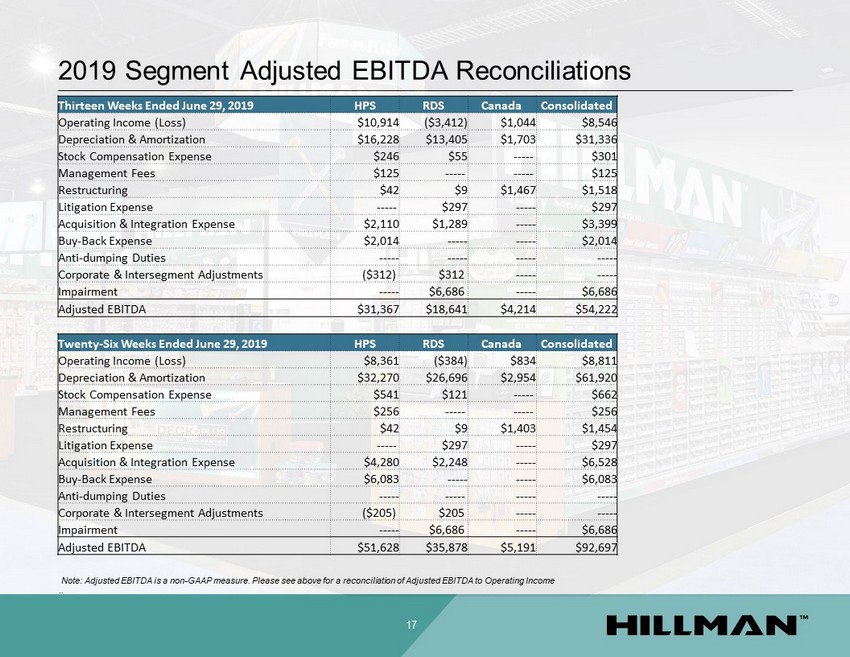
2019 Segment Adjusted EBITDA Reconciliations 17 Note: Adjusted EBITDA is a non - GAAP measure. Please see above for a reconciliation of Adjusted EBITDA to Operating Income .. Thirteen Weeks Ended June 29, 2019 HPS RDS Canada Consolidated Operating Income (Loss) $10,914 ($3,412) $1,044 $8,546 Depreciation & Amortization $16,228 $13,405 $1,703 $31,336 Stock Compensation Expense $246 $55 ----- $301 Management Fees $125 ----- ----- $125 Restructuring $42 $9 $1,467 $1,518 Litigation Expense ----- $297 ----- $297 Acquisition & Integration Expense $2,110 $1,289 ----- $3,399 Buy - Back Expense $2,014 ----- ----- $2,014 Anti - dumping Duties ----- ----- ----- ----- Corporate & Intersegment Adjustments ($312) $312 ----- ----- Impairment ----- $6,686 ----- $6,686 Adjusted EBITDA $31,367 $18,641 $4,214 $54,222 Twenty - Six Weeks Ended June 29, 2019 HPS RDS Canada Consolidated Operating Income (Loss) $8,361 ($384) $834 $8,811 Depreciation & Amortization $32,270 $26,696 $2,954 $61,920 Stock Compensation Expense $541 $121 ----- $662 Management Fees $256 ----- ----- $256 Restructuring $42 $9 $1,403 $1,454 Litigation Expense ----- $297 ----- $297 Acquisition & Integration Expense $4,280 $2,248 ----- $6,528 Buy - Back Expense $6,083 ----- ----- $6,083 Anti - dumping Duties ----- ----- ----- ----- Corporate & Intersegment Adjustments ($205) $205 ----- ----- Impairment ----- $6,686 ----- $6,686 Adjusted EBITDA $51,628 $35,878 $5,191 $92,697