425: Filing under Securities Act Rule 425 of certain prospectuses and communications in connection with business combination transactions
Published on March 3, 2021
Filed by Landcadia Holdings III, Inc. pursuant to Rule 425
under the Securities Act of 1933
and deemed filed pursuant to Rule 14a-12
under the Securities Exchange Act of 1934
Subject Company: Landcadia Holdings III, Inc. (File No. 001-39609)
The press releases and investor presentation set forth below were furnished by Landcadia Holdings III, Inc. on March 3, 2021 as Exhibits 99.1, 99.2 and 99.3, respectively, to a Current Report on Form 8-K in connection with the proposed business combination between Landcadia Holdings III, Inc. and HMAN Group Holdings, Inc (together with its direct and indirect subsidiaries, “Hillman”).
The following is a press release issued by Hillman on March 3, 2021:
The Hillman Group Announces Pricing and Commitments for $1.185 Billion of Term Loans in Heavily Oversubscribed Transaction
CINCINNATI and HOUSTON, March 3, 2021 – The Hillman Companies, Inc. (the "Company" or "Hillman”), a leader in the hardware and home improvement industry, has successfully completed the syndication of $1,185 million new term loan commitments to refinance its capital structure. The financing will be used in connection with and contingent upon the Company's merger with Landcadia Holdings III Inc. (Nasdaq: LCY) (“Landcadia”), a special purpose acquisition company. The financing also includes a $250 million, five-year asset-based revolving credit facility.
Summary of new term loans:
| · | $835 - $985 million Term Loan (final principal amount subject to actual Landcadia shareholder redemptions in connection with the merger) |
| · | $200 million Delayed-Draw Term Loan |
| · | LIBOR plus 2.75% (subject to the 50-basis point floor) with 0.25% original issue discount |
| · | Upon reduction of the leverage by 0.5x or more from the pro forma leverage ratio at closing, a rate reduction to LIBOR plus 2.50% |
| · | Term Loan and Delayed Draw Term Loan maturity to be 7 years after closing |
The syndication of the new term loans was approximately four times oversubscribed and, as a result, achieved more favorable terms than the initial price talk of LIBOR plus 3.00-3.25% with 0.50% original issue discount.
Rocky Kraft, Chief Financial Officer, commented, “We are very pleased with the better than expected execution we realized on these credit facilities. This accomplishes an important milestone on our road to merging with Landcadia III and, together with continued strong momentum in our sales in the first quarter, becoming a successful public company.”
Jefferies and Barclays acted as Joint Bookrunners and Joint Lead Arrangers on the New Term Loan. Jefferies is the Administrative Agent.
On January 25, 2021, Hillman and Landcadia III announced that they entered into a definitive merger agreement that will result in Hillman becoming a publicly listed company. Upon the closing of the transaction, which is expected to occur in the second quarter of 2021, the combined company will be named Hillman Solutions Corp. and remain listed on Nasdaq under the new ticker symbol “HLMN.”
About Hillman
About Hillman Founded in 1964 and headquartered in Cincinnati, Ohio, Hillman is a leading North American provider of complete hardware solutions, delivered with industry best customer service to over 40,000 locations. Hillman designs innovative product and merchandising solutions for complex categories that deliver an outstanding customer experience to home improvement centers, mass merchants, national and regional hardware stores, pet supply stores, and OEM & Industrial customers. Leveraging a world-class distribution and sales network, Hillman delivers a “small business” experience with “big business” efficiency. For more information on Hillman, visit https://www.hillmangroup.com/us/en.
Landcadia Holdings III, Inc.
Landcadia III is a blank check company whose business purpose is to effect a merger, capital stock exchange, asset acquisition, stock purchase, reorganization or similar business combination with one or more businesses. Landcadia III’s sponsors are TJF, LLC, which is wholly-owned by Mr. Fertitta, and Jefferies Financial Group Inc. Landcadia III’s management team is led by Mr. Fertitta, its Chief Executive Officer and Co-Chairman of its Board of Directors and the sole shareholder, Chairman and Chief Executive Officer of Fertitta Entertainment, Inc., and Mr. Handler, Landcadia III’s President, other Co-Chairman of its Board of Directors and the Chief Executive Officer of Jefferies Financial Group Inc. Landcadia III raised $500,000,000 in its initial public offering in October 2020 and is listed on Nasdaq under the ticker symbol "LCY."
Forward-Looking Statements
This press release includes "forward-looking statements" within the meaning of the "safe harbor" provisions of the Private Securities Litigation Reform Act of 1995. The Company's and Landcadia III’s actual results may differ from their expectations, estimates and projections and consequently, you should not rely on these forward looking statements as predictions of future events. Words such as "expect," "estimate," "project," "budget," "forecast," "anticipate," "intend," "plan," "may," "will," "could," "should," "believes," "predicts," "potential," "continue," and similar expressions are intended to identify such forward-looking statements. These forward-looking statements include, without limitation, the Company's and Landcadia III’s expectations with respect to future performance and anticipated financial impacts of the proposed business combination, the satisfaction of the closing conditions to the proposed transaction and the timing of the completion of the proposed transaction. These forward-looking statements involve significant risks and uncertainties that could cause the actual results to differ materially from the expected results. Most of these factors are outside the Company's and Landcadia III’s control and are difficult to predict. Factors that may cause such differences include, but are not limited to: (1) the risk that the proposed business combination disrupts the Company’s current plans and operations; (2) the ability to recognize the anticipated benefits of the proposed business combination, which may be affected by, among other things, competition, the ability of the Company to grow and manage growth profitably and retain its key employees; (3) costs related to the proposed business combination; (4) changes in applicable laws or regulations; (5) the possibility that Landcadia III or the Company may be adversely affected by other economic, business, and/or competitive factors; (6) the occurrence of any event, change or other circumstances that could give rise to the termination of the merger agreement; (7) the outcome of any legal proceedings that may be instituted against Landcadia III or the Company following the announcement of the merger agreement; (8) the inability to complete the proposed business combination, including due to failure to obtain approval of the stockholders of Landcadia III or Hillman, certain regulatory approvals or satisfy other conditions to closing in the merger agreement; (9) the impact of COVID-19 on the Company’s business and/or the ability of the parties to complete the proposed business combination; (10) the inability to obtain or maintain the listing of the combined company’s shares of common stock on Nasdaq following the proposed transaction; or (11) other risks and uncertainties indicated from time to time in the registration statement containing the proxy statement/prospectus relating to the proposed business combination, including those under "Risk Factors" therein, and in Landcadia III’s or the Company's other filings with the SEC. The foregoing list of factors is not exclusive, and readers should also refer to those risks that will be included under the header “Risk Factors” in the registration statement on Form S-4 filed by Landcadia III with the SEC and those included under the header “Risk Factors” in the final prospectus of Landcadia III related to its initial public offering. Readers are cautioned not to place undue reliance upon any forward-looking statements in this press release, which speak only as of the date made. Landcadia III and the Company do not undertake or accept any obligation or undertaking to release publicly any updates or revisions to any forward-looking statements in this press release to reflect any change in its expectations or any change in events, conditions or circumstances on which any such statement is based.
No Offer or Solicitation
This press release shall not constitute a solicitation of a proxy, consent or authorization with respect to any securities or in respect of the proposed transaction. This press release shall also not constitute an offer to sell or the solicitation of an offer to buy any securities, nor shall there be any sale of securities in any states or jurisdictions in which such offer, solicitation or sale would be unlawful prior to registration or qualification under the securities laws of any such jurisdiction. No offering of securities shall be made except by means of a prospectus meeting the requirements of Section 10 of the Securities Act of 1933, as amended.
Additional Information and Where to Find It
In connection with the proposed business combination, Landcadia III filed a registration statement on Form S-4 with the Securities and Exchange Commission (the “SEC”), which includes a proxy statement/prospectus, that will be both the proxy statement to be distributed to holders of Landcadia III’s common stock in connection with its solicitation of proxies for the vote by Landcadia III’s stockholders with respect to the proposed business combination and other matters as may be described in the registration statement, as well as the prospectus relating to the offer and sale of the securities to be issued in the business combination. After the registration statement is declared effective, Landcadia III will mail a definitive proxy statement/prospectus and other relevant documents to its stockholders. This document does not contain all the information that should be considered concerning the proposed business combination and is not intended to form the basis of any investment decision or any other decision in respect of the business combination. Landcadia III’s stockholders, the Company’s stockholders and other interested persons are advised to read the preliminary proxy statement/prospectus included in the registration statement and, when available, the amendments thereto and the definitive proxy statement/prospectus and other documents filed in connection with the proposed business combination, as these materials will contain important information about the Company, Landcadia III and the business combination. When available, the definitive proxy statement/prospectus and other relevant materials for the proposed business combination will be mailed to stockholders of Landcadia III as of a record date to be established for voting on the proposed business combination. Landcadia III’s stockholders and the Company’s stockholders will also be able to obtain copies of the preliminary proxy statement, the definitive proxy statement and other documents filed with the SEC, without charge, once available, at the SEC’s website at www.sec.gov, or by directing a request to: Landcadia Holdings III, Inc., 1510 West Loop South, Houston, Texas 77027, Attention: General Counsel, (713) 850-1010.
Participants in the Solicitation
Landcadia III and Hillman and their respective directors and officers may be deemed participants in the solicitation of proxies of Landcadia III’s stockholders in connection with the proposed business combination. A list of the names of Landcadia III’s directors and executive officers and a description of their interests in Landcadia III is contained in Landcadia III’s registration statement on Form S-4 containing the proxy statement / prospectus for the business combination, which was filed with the SEC and is available free of charge at the SEC’s web site at www.sec.gov. Information about the Company’s directors and executive officers is available in Hillman’s Form 10-K for the year ended December 26, 2020 and certain of its Current Reports on Form 8-K.
Information regarding the persons who may, under SEC rules, be deemed participants in the solicitation of proxies to Landcadia III stockholders in connection with the proposed business combination is set forth in the registration statement on Form S-4 containing the proxy statement / prospectus for the business combination. Additional information regarding the interests of participants in the solicitation of proxies in connection with the proposed business combination is included in the proxy statement that Landcadia III filed with the SEC, including Jefferies Financial Group Inc.’s and/or its affiliate’s various roles in the transaction. You should keep in mind that the interest of participants in such solicitation of proxies may have financial interests that are different from the interests of the other participants. These documents can be obtained free of charge from the sources indicated above.
Contacts
Investor Relations
Rodny Nacier / Brad Cray
IR@hillmangroup.com
(513) 826-5495
Public Relations
Phil Denning / Doug Donsky
media@hillmangroup.com
The following is a press release issued by Hillman on March 3, 2021:

News Release
The Hillman Group Reports Record Fourth Quarter and Full Year 2020 Results
| • | Focused execution and solid demand drove record fourth quarter and full year results |
| • | Completed a highly successful debt syndication in connection with planned merger with Landcadia III |
| • | Seeing continued strong business momentum in 2021 |
| • | Earnings conference call to be held on March 4, 2021 at 8:30 AM ET |
CINCINNATI and HOUSTON, March 3, 2021 -- The Hillman Companies, Inc. (NYSE-AMEX: HLM.PR) (the “Company” or “Hillman”) reported today selected financial results for the fourth quarter and full year ended December 26, 2020.
Fourth Quarter 2020 Highlights
| • | Net sales for the fourth quarter of 2020 increased 14.8% to $327.1 million as compared to prior year quarter net sales of $284.8 million |
| • | Adjusted EBITDA1 increased 22.7% to $43.1 million compared to $35.1 million in the prior year quarter |
| • | Net loss for the fourth quarter of 2020 was $14.0 million compared to a prior year quarter loss of $30.7 million |
Full Year 2020 Highlights
| • | Net sales for the full year 2020 increased 12.7% to $1,368.3 million as compared to $1,214.4 million in 2019 |
| • | Adjusted EBITDA1 for the full year 2020 increased 23.8% to $221.2 million compared to $178.7 million in 2019 |
| • | Net loss narrowed to $24.5 million compared to $85.5 million in 2019 |
Doug Cahill, Chairman and Chief Executive Officer, stated “The power of the Hillman platform was fully evident in 2020 and I am extremely proud of all that the Hillman team accomplished. Not only did we post record financial results but our sales, service and supply chain teams met record levels of customer demand and delivered Hillman's unmatched in store service, all while dealing with the substantial disruptions caused by the pandemic.”
Mr. Cahill continued, “We had a strong finish to 2020 and this momentum is continuing into 2021. We are seeing positive tailwinds from repair, remodel, and outdoor living trends as homes transform to meet the needs of work, school, recreation and other activities. We also see continued strong demand for PPE and exciting new initiatives are being launched in our RDS segment. We entered 2021 well situated to drive share gains with our customers, strengthen the moat around our business and deliver another year of solid sales, margins, cash flow and superior returns, and we are off to a strong start.”
1) Adjusted EBITDA is a non-GAAP financial measure. Refer to the "Reconciliation of Adjusted EBITDA” section of this press release for additional information as well as reconciliations between the company’s GAAP and non-GAAP financial results.
Debt Refinancing and Capital Resources
At December 26, 2020, the Company had $21.5 million of cash on our balance sheet and had $1,549.8 million of total debt outstanding. The Company had $154.4 million of availability under its revolving credit facility.
As separately announced today, the Company successfully completed the syndication of $1.185 billion in new term loan commitments in a four times oversubscribed transaction. The term loans will be used in connection with and contingent upon the Company's planned merger with Landcadia Holdings III Inc. (“Landcadia III”), a publicly-traded special purpose acquisition company, to repay all existing outstanding indebtedness. In addition, the financing includes a $250 million, five-year asset-based revolving credit facility, also contingent on closing of the merger with Landcadia III. Through the merger, refinancing and related transactions, the Company will simplify its capital structure and substantially lower expected total cash interest costs.
Planned Merger with Landcadia III
On January 25, 2021, Hillman and Landcadia III announced that they entered into a definitive merger agreement that will result in Hillman becoming a publicly listed company. Upon the closing of the transaction, which is expected to occur in the second quarter of 2021, the combined company will be named Hillman Solutions Corp. and remain listed on Nasdaq under the new ticker symbol “HLMN.”
Conference Call and Webcast
The Company will host a conference call to discuss the financial results for the fourth quarter and full year ended December 26, 2020 on Thursday, March 4, 2021, at 8:30 am Eastern time. Participants may join the call by dialing 1-(877)-407-9208 a few minutes before the call start time. A live audio webcast of the conference call will also be available in a listen-only mode on the Investor Info page of the Company’s website, which is located at www.hillmangroup.com. Participants who want to access the webcast should visit the company's website about five minutes before the call. The archived webcast will be available for replay on the company's website after the call.
About Hillman
Founded in 1964 and headquartered in Cincinnati, Ohio, Hillman is a leading North American provider of complete hardware solutions, delivered with industry best customer service to over 40,000 locations. Hillman designs innovative product and merchandising solutions for complex categories that deliver an outstanding customer experience to home improvement centers, mass merchants, national and regional hardware stores, pet supply stores, and OEM & Industrial customers. Leveraging a world-class distribution and sales network, Hillman delivers a “small business” experience with “big business” efficiency. For more information on Hillman, visit https://www.hillmangroup.com/us/en.
Landcadia Holdings III, Inc.
Landcadia III is a blank check company whose business purpose is to effect a merger, capital stock exchange, asset acquisition, stock purchase, reorganization or similar business combination with one or more businesses. Landcadia III’s sponsors are TJF, LLC, which is wholly-owned by Mr. Fertitta, and Jefferies Financial Group Inc. Landcadia III’s management team is led by Mr. Fertitta, its Chief Executive Officer and Co-Chairman of its Board of Directors and the sole shareholder, Chairman and Chief Executive Officer of Fertitta Entertainment, Inc., and Mr. Handler, Landcadia III’s President, other Co-Chairman of its Board of Directors and the Chief Executive Officer of Jefferies Financial Group Inc. Landcadia III raised $500,000,000 in its initial public offering in October 2020 and is listed on Nasdaq under the ticker symbol "LCY."
Forward-Looking Statements
This press release includes "forward-looking statements" within the meaning of the "safe harbor" provisions of the Private Securities Litigation Reform Act of 1995. The Company's and Landcadia III’s actual results may differ from their expectations, estimates and projections and consequently, you should not rely on these forward looking statements as predictions of future events. Words such as "expect," "estimate," "project," "budget," "forecast," "anticipate," "intend," "plan," "may," "will," "could," "should," "believes," "predicts," "potential," "continue," and similar expressions are intended to identify such forward-looking statements. These forward-looking statements include, without limitation, the Company's and Landcadia III’s expectations with respect to future performance and anticipated financial impacts of the proposed business combination, the satisfaction of the closing conditions to the proposed transaction and the timing of the completion of the proposed transaction. These forward-looking statements involve significant risks and uncertainties that could cause the actual results to differ materially from the expected results. Most of these factors are outside the Company's and Landcadia III’s control and are difficult to predict. Factors that may cause such differences include, but are not limited to: (1) the risk that the proposed business combination disrupts the Company’s current plans and operations; (2) the ability to recognize the anticipated benefits of the proposed business combination, which may be affected by, among other things, competition, the ability of the Company to grow and manage growth profitably and retain its key employees; (3) costs related to the proposed business combination; (4) changes in applicable laws or regulations; (5) the possibility that Landcadia III or the Company may be adversely affected by other economic, business, and/or competitive factors; (6) the occurrence of any event, change or other circumstances that could give rise to the termination of the merger agreement; (7) the outcome of any legal proceedings that may be instituted against Landcadia III or the Company following the announcement of the merger agreement; (8) the inability to complete the proposed business combination, including due to failure to obtain approval of the stockholders of Landcadia III or Hillman, certain regulatory approvals or satisfy other conditions to closing in the merger agreement; (9) the impact of COVID-19 on the Company’s business and/or the ability of the parties to complete the proposed business combination; (10) the inability to obtain or maintain the listing of the combined company’s shares of common stock on Nasdaq following the proposed transaction; or (11) other risks and uncertainties indicated from time to time in the registration statement containing the proxy statement/prospectus relating to the proposed business combination, including those under "Risk Factors" therein, and in Landcadia III’s or the Company's other filings with the SEC. The foregoing list of factors is not exclusive, and readers should also refer to those risks that will be included under the header “Risk Factors” in the registration statement on Form S-4 filed by Landcadia III with the SEC and those included under the header “Risk Factors” in the final prospectus of Landcadia III related to its initial public offering. Readers are cautioned not to place undue reliance upon any forward-looking statements in this press release, which speak only as of the date made. Landcadia III and the Company do not undertake or accept any obligation or undertaking to release publicly any updates or revisions to any forward-looking statements in this press release to reflect any change in its expectations or any change in events, conditions or circumstances on which any such statement is based.
No Offer or Solicitation
This press release shall not constitute a solicitation of a proxy, consent or authorization with respect to any securities or in respect of the proposed transaction. This press release shall also not constitute an offer to sell or the solicitation of an offer to buy any securities, nor shall there be any sale of securities in any states or jurisdictions in which such offer, solicitation or sale would be unlawful prior to registration or qualification under the securities laws of any such jurisdiction. No offering of securities shall be made except by means of a prospectus meeting the requirements of Section 10 of the Securities Act of 1933, as amended.
Additional Information and Where to Find It
In connection with the proposed business combination, Landcadia III filed a registration statement on Form S-4 with the Securities and Exchange Commission (the “SEC”), which includes a proxy statement/prospectus, that will be both the proxy statement to be distributed to holders of Landcadia III’s common stock in connection with its solicitation of proxies for the vote by Landcadia III’s stockholders with respect to the proposed business combination and other matters as may be described in the registration statement, as well as the prospectus relating to the offer and sale of the securities to be issued in the business combination. After the registration statement is declared effective, Landcadia III will mail a definitive proxy statement/prospectus and other relevant documents to its stockholders. This document does not contain all the information that should be considered concerning the proposed business combination and is not intended to form the basis of any investment decision or any other decision in respect of the business combination. Landcadia III’s stockholders, the Company’s stockholders and other interested persons are advised to read the preliminary proxy statement/prospectus included in the registration statement and, when available, the amendments thereto and the definitive proxy statement/prospectus and other documents filed in connection with the proposed business combination, as these materials will contain important information about the Company, Landcadia III and the business combination. When available, the definitive proxy statement/prospectus and other relevant materials for the proposed business combination will be mailed to stockholders of Landcadia III as of a record date to be established for voting on the proposed business combination. Landcadia III’s stockholders and the Company’s stockholders will also be able to obtain copies of the preliminary proxy statement, the definitive proxy statement and other documents filed with the SEC, without charge, once available, at the SEC’s website at www.sec.gov, or by directing a request to: Landcadia Holdings III, Inc., 1510 West Loop South, Houston, Texas 77027, Attention: General Counsel, (713) 850-1010.
Participants in the Solicitation
Landcadia III and Hillman and their respective directors and officers may be deemed participants in the solicitation of proxies of Landcadia III’s stockholders in connection with the proposed business combination. A list of the names of Landcadia III’s directors and executive officers and a description of their interests in Landcadia III is contained in Landcadia III’s registration statement on Form S-4 containing the proxy statement / prospectus for the business combination, which was filed with the SEC and is available free of charge at the SEC’s web site at www.sec.gov. Information about the Company’s directors and executive officers is available in Hillman’s Form 10-K for the year ended December 26, 2020 and certain of its Current Reports on Form 8-K.
Information regarding the persons who may, under SEC rules, be deemed participants in the solicitation of proxies to Landcadia III stockholders in connection with the proposed business combination is set forth in the registration statement on Form S-4 containing the proxy statement / prospectus for the business combination. Additional information regarding the interests of participants in the solicitation of proxies in connection with the proposed business combination is included in the proxy statement that Landcadia III filed with the SEC, including Jefferies Financial Group Inc.’s and/or its affiliate’s various roles in the transaction. You should keep in mind that the interest of participants in such solicitation of proxies may have financial interests that are different from the interests of the other participants. These documents can be obtained free of charge from the sources indicated above.
Contacts
Investor Relations
Rodny Nacier / Brad Cray IR@hillmangroup.com
(513) 826-5495
Public Relations
Phil Denning / Doug Donsky
media@hillmangroup.com
THE HILLMAN COMPANIES, INC. AND SUBSIDIARIES
Consolidated Statement of Operating Income, GAAP Basis
(dollars in thousands)
Unaudited
| Thirteen Weeks Ended December 26, 2020 |
Thirteen Weeks Ended December 28, 2019 As Restated (1) |
Year Ended December 26, 2020 |
Year Ended December 28, 2019 As Restated (1) |
|||||||||||||
| Net sales | $ | 327,069 | $ | 284,798 | $ | 1,368,295 | $ | 1,214,362 | ||||||||
| Cost of sales (exclusive of depreciation and amortization shown separately below) | 191,521 | 170,065 | 781,815 | 693,881 | ||||||||||||
| Selling, general and administrative expenses | 106,416 | 94,084 | 398,472 | 382,131 | ||||||||||||
| Depreciation | 16,750 | 16,918 | 67,423 | 65,658 | ||||||||||||
| Amortization | 14,896 | 14,796 | 59,492 | 58,910 | ||||||||||||
| Management fees to related party | 126 | 166 | 577 | 562 | ||||||||||||
| Other (income) expense | (3,130 | ) | (162 | ) | (5,250 | ) | 5,525 | |||||||||
| Income from operations | 490 | (11,069 | ) | 65,766 | 7,695 | |||||||||||
| Interest expense, net | 19,028 | 24,104 | 86,774 | 101,613 | ||||||||||||
| Interest expense on junior subordinated debentures | 3,152 | 3,152 | 12,707 | 12,608 | ||||||||||||
| Investment income on trust common securities | (1,547 | ) | (3,595 | ) | (378 | ) | (378 | ) | ||||||||
| Loss on mark-to-market adjustment of interest rate swap | 884 | 2,892 | 601 | 2,608 | ||||||||||||
| Loss before income taxes | (21,027 | ) | (37,622 | ) | (33,938 | ) | (108,756 | ) | ||||||||
| Income tax benefit | (7,065 | ) | (6,896 | ) | (9,439 | ) | (23,277 | ) | ||||||||
| Net loss | $ | (13,962 | ) | $ | (30,726 | ) | $ | (24,499 | ) | $ | (85,479 | ) | ||||
| (1) | We have restated our financial statements for 2019 due to the correction of errors in the technical accounting for income taxes related to the valuation allowance against deferred tax assets, which impacted our net deferred tax liabilities. See our previously filed 8-K for details on the restatement. |
THE HILLMAN COMPANIES, INC. AND SUBSIDIARIES
Consolidated Balance Sheets
(dollars in thousands)
Unaudited
| December 26, 2020 | December 28, 2019 As Restated (1) |
|||||||
| ASSETS | ||||||||
| Current assets: | ||||||||
| Cash and cash equivalents | $ | 21,520 | $ | 19,973 | ||||
| Accounts receivable, net of allowances of $2,395 ($1,891 - 2019) | 121,228 | 88,374 | ||||||
| Inventories, net | 391,679 | 323,496 | ||||||
| Other current assets | 19,280 | 8,828 | ||||||
| Total current assets | 553,707 | 440,671 | ||||||
| Property and equipment, net of accumulated depreciation of $236,031 ($179,791 - 2019) | 182,674 | 205,160 | ||||||
| Goodwill | 816,200 | 815,850 | ||||||
| Other intangibles, net of accumulated amortization of $291,434 ($232,060 - 2019) | 825,966 | 882,430 | ||||||
| Operating lease right of use assets | 76,820 | 81,613 | ||||||
| Deferred tax asset | 2,075 | 702 | ||||||
| Other assets | 11,176 | 11,557 | ||||||
| Total assets | $ | 2,468,618 | $ | 2,437,983 | ||||
| LIABILITIES AND STOCKHOLDER'S EQUITY | ||||||||
| Current liabilities: | ||||||||
| Accounts payable | $ | 201,461 | $ | 125,042 | ||||
| Current portion of debt and capital lease obligations | 11,481 | 11,358 | ||||||
| Current portion of operating lease liabilities | 12,168 | 11,459 | ||||||
| Accrued expenses: | ||||||||
| Salaries and wages | 29,800 | 12,937 | ||||||
| Pricing allowances | 6,422 | 6,553 | ||||||
| Income and other taxes | 5,986 | 5,248 | ||||||
| Interest | 12,988 | 14,726 | ||||||
| Other accrued expenses | 31,605 | 21,545 | ||||||
| Total current liabilities | 311,911 | 208,868 | ||||||
| Long-term debt | 1,535,508 | 1,584,289 | ||||||
| Deferred tax liabilities | 156,118 | 164,343 | ||||||
| Operating lease liabilities | 68,934 | 73,227 | ||||||
| Other non-current liabilities | 31,560 | 33,287 | ||||||
| Total liabilities | 2,104,031 | 2,064,014 | ||||||
| Commitments and Contingencies (Note 15) | — | — | ||||||
| Stockholder's Equity: | ||||||||
| Preferred stock, $0.01 par, 5,000 shares authorized, none issued and outstanding at December 26, 2020 and December 28, 2019 | — | — | ||||||
| Common stock, $0.01 par, 5,000 shares authorized, issued and outstanding at December 26, 2020 and December 28, 2019 | — | — | ||||||
| Additional paid-in capital | 565,824 | 553,359 | ||||||
| Accumulated deficit | (171,849 | ) | (147,350 | ) | ||||
| Accumulated other comprehensive loss | (29,388 | ) | (32,040 | ) | ||||
| Total stockholder's equity | 364,587 | 373,969 | ||||||
| Total liabilities and stockholder's equity | $ | 2,468,618 | $ | 2,437,983 | ||||
| (1) | We have restated our financial statements for 2019 due to the correction of errors in the technical accounting for income taxes related to the valuation allowance against deferred tax assets, which impacted our net deferred tax liabilities. See our previously filed 8-K for details on the restatement. |
THE HILLMAN COMPANIES, INC. AND SUBSIDIARIES
Consolidated Statement of Cash Flows
(dollars in thousands)
Unaudited
| Year Ended December 26, 2020 |
Year Ended December 28, 2019 As Restated (1) |
|||||||
| Cash flows from operating activities: | ||||||||
| Net loss | $ | (24,499 | ) | $ | (85,479 | ) | ||
| Adjustments to reconcile net loss to net cash provided by operating activities: | ||||||||
| Depreciation and amortization | 126,915 | 124,568 | ||||||
| Loss (gain) on dispositions of property and equipment | 161 | (573 | ) | |||||
| Impairment of long lived assets | 210 | 7,887 | ||||||
| Deferred income taxes | (9,462 | ) | (23,586 | ) | ||||
| Deferred financing and original issue discount amortization | 3,722 | 3,726 | ||||||
| Loss on debt restructuring | — | — | ||||||
| Stock-based compensation expense | 5,125 | 2,981 | ||||||
| Change in fair value of contingent consideration | (3,515 | ) | — | |||||
| Other non-cash interest and change in value of interest rate swap | 601 | 2,608 | ||||||
| Changes in operating items: | ||||||||
| Accounts receivable | (32,417 | ) | 22,863 | |||||
| Inventories | (67,147 | ) | (3,205 | ) | ||||
| Other assets | (10,743 | ) | 2,878 | |||||
| Accounts payable | 76,031 | (11,975 | ) | |||||
| Other accrued liabilities | 27,098 | 9,666 | ||||||
| Net cash provided by operating activities | 92,080 | 52,359 | ||||||
| Cash flows from investing activities: | ||||||||
| Acquisitions of businesses, net of cash acquired | (800 | ) | (6,135 | ) | ||||
| Capital expenditures | (45,274 | ) | (57,753 | ) | ||||
| Proceeds from sale of property and equipment | — | 10,400 | ||||||
| Net cash used for investing activities | (46,074 | ) | (53,488 | ) | ||||
| Cash flows from financing activities: | ||||||||
| Repayments of senior term loans | (10,608 | ) | (10,608 | ) | ||||
| Borrowings of revolving credit loans | 99,000 | 43,500 | ||||||
| Repayments of revolving credit loans | (140,000 | ) | (38,700 | ) | ||||
| Financing fees | — | (1,412 | ) | |||||
| Principal payments under capitalized lease obligations | (836 | ) | (683 | ) | ||||
| Proceeds from exercise of stock options | 7,340 | 100 | ||||||
| Proceeds from sale of Holdco stock | — | 750 | ||||||
| Net cash (used for) provided by financing activities | (45,104 | ) | (7,053 | ) | ||||
| Effect of exchange rate changes on cash | 645 | (79 | ) | |||||
| Net increase (decrease) in cash and cash equivalents | 1,547 | (8,261 | ) | |||||
| Cash and cash equivalents at beginning of period | 19,973 | 28,234 | ||||||
| Cash and cash equivalents at end of period | $ | 21,520 | $ | 19,973 | ||||
| (1) | We have restated our financial statements for 2019 due to the correction of errors in the technical accounting for income taxes related to the valuation allowance against deferred tax assets, which impacted our net deferred tax liabilities. See our previously filed 8-K for details on the restatement. |
THE HILLMAN COMPANIES, INC. AND SUBSIDIARIES
RECONCILIATION OF ADJUSTED EBITDA (Unaudited)
(dollars in thousands)
Adjusted EBITDA is a non-GAAP financial measure and is the primary basis used to measure the operational strength and performance of our businesses as well as to assist in the evaluation of underlying trends in our businesses. This measure eliminates the significant level of noncash depreciation and amortization expense that results from the capital-intensive nature of our businesses and from intangible assets recognized in business combinations. It is also unaffected by our capital and tax structures, as our management excludes these results when evaluating our operating performance. Our management and Board of Directors use this financial measure to evaluate our consolidated operating performance and the operating performance of our operating segments and to allocate resources and capital to our operating segments. Additionally, we believe that Adjusted EBITDA is useful to investors because it is one of the bases for comparing our operating performance with that of other companies in our industries, although our measure of Adjusted EBITDA may not be directly comparable to similar measures used by other companies.
We have restated our financial statements for 2019 due to the correction of errors in the accounting for income taxes related to the valuation allowance against deferred tax assets, which impacted our net deferred tax liabilities. Accordingly, the EBITDA reconciliation below has been restated. There was no impact to EBITDA or Adjusted EBITDA in 2019. The following table presents a reconciliation of Net loss, the most directly comparable financial measures under GAAP, to Adjusted EBITDA for the periods presented:
| Thirteen Weeks Ended December 26, 2020 |
Thirteen Weeks Ended December 28, 2019 As Restated |
Year Ended December 26, 2020 |
Year Ended December 28, 2019 As Restated |
|||||||||||||
| Net loss | $ | (13,962 | ) | $ | (30,726 | ) | $ | (24,499 | ) | $ | (85,479 | ) | ||||
| Income tax (benefit) expense | (7,065 | ) | (6,896 | ) | (9,439 | ) | (23,277 | ) | ||||||||
| Interest expense, net | 19,028 | 24,104 | 86,774 | 101,613 | ||||||||||||
| Interest expense on junior subordinated debentures | 3,152 | 3,152 | 12,707 | 12,608 | ||||||||||||
| Investment income on trust common securities | (1,547 | ) | (3,595 | ) | (378 | ) | (378 | ) | ||||||||
| Depreciation | 16,750 | 16,918 | 67,423 | 65,658 | ||||||||||||
| Amortization | 14,896 | 14,796 | 59,492 | 58,910 | ||||||||||||
| Mark-to-market adjustment on interest rate swaps | 884 | 2,892 | 601 | 2,608 | ||||||||||||
| EBITDA | $ | 32,136 | $ | 20,645 | $ | 192,681 | $ | 132,263 | ||||||||
| Stock compensation expense | 1,307 | 1,075 | 5,125 | 2,981 | ||||||||||||
| Management fees | 126 | 166 | 577 | 562 | ||||||||||||
| Facility exits (1) | 428 | — | 3,894 | — | ||||||||||||
| Restructuring (2) | 1,475 | 9,183 | 4,902 | 13,749 | ||||||||||||
| Litigation expense (3) | 2,066 | 651 | 7,719 | 1,463 | ||||||||||||
| Acquisition and integration expense (4) | 7,788 | 1,319 | 9,832 | 12,557 | ||||||||||||
| Change in fair value of contingent consideration | (2,215 | ) | — | (3,515 | ) | — | ||||||||||
| Buy-back expense (5) | — | 1,113 | — | 7,196 | ||||||||||||
| Asset impairment charges (6) | — | 991 | — | 7,887 | ||||||||||||
| Adjusted EBITDA | $ | 43,111 | $ | 35,143 | $ | 221,215 | $ | 178,658 | ||||||||
| (1) | Facility exits include costs associated with the closure of facilities in Parma, Ohio, San Antonio, Texas, and Dallas, Texas. |
| (2) | Restructuring includes restructuring costs associated with restructuring in our Canada segment announced in 2018, including facility consolidation, stock keeping unit rationalization, severance, sale of property and equipment, and charges relating to exiting certain lines of business. Also included is restructuring in our United Stated business announced in 2019, including severance related to management realignment and the integration of sales and operating functions. Finally, includes consulting and other costs associated with streamlining our manufacturing and distribution operations. |
| (3) | Litigation expense includes legal fees associated with our ongoing litigation with KeyMe, Inc. |
| (4) | Acquisition and integration expense includes professional fees, non-recurring bonuses, and other costs related to historical acquisitions. |
| (5) | Buy-back expense includes one-time payments made to customers associated with the new product line roll outs for construction fastener products and builders hardware. |
| (6) | Asset impairment charges includes impairment losses for the disposal of FastKey self-service key duplicating kiosks and related assets |

Investor Presentation March 2021
This presentation (the “presentation”) is being delivered to a limited number of parties for informational purposes only and doe s not constitute an offer to sell, a solicitation of an offer to buy, or a recommendation to purchase any equity, debtor othe r f inancial instruments of Landcadia Holdings III, Inc. (“Landcadia”) or The Hillman Companies, Inc. (“Hillman”) or any of their respective affiliates. The presen tat ion has been prepared to assist parties in making their own evaluation with respect to the proposed business combination (the "B usiness Combination") between Landcadia and Hillman and for no other purpose. It is not intended to form the basis of any investment decision or any other dec isions with respect of the Business Combination. No Representation or Warranty . No representation or warranty, express or implied, is or will be given by Landcadia or Hillman or any of their respective aff ili ates, directors, officers, employees or advisers or any other person as to the accuracy or completeness of the information in th is presentation or any other written, oral or other communications transmitted or otherwise made available to any party in the c our se of its evaluation of the Business Combination, and no responsibility or liability whatsoever is accepted for the accuracy or sufficiency thereof or for any errors, omissions or misstatements, negligent or otherwise, relating thereto. This presentation does not purport to contain all of th e i nformation that may be required to evaluate a possible investment decision with respect to Landcadia or Hillman, and does not co nstitute investment, tax or legal advice. The recipient also acknowledges and agrees that the information contained in this presentation is preliminary in natu re and is subject to change, and any such changes may be material. Landcadia and Hillman disclaim any duty to update the informa tio n contained in this presentation. Any and all trademarks and trade names referred to in this presentation are the property of their respective ow ner s. The only obligations of any such person shall be those of Landcadia and Hillman set forth in a definitive agreement execut ed by Landcadia and Hillman regarding a possible negotiated transaction with Landcadia and Hillman. The proposed Business Combination is subject to, amon g o ther things, the negotiation and execution of a definitive agreement providing for the Business Combination, the approval by Lan dcadia's stockholders, satisfaction of the conditions set forth in the definitive agreement. Accordingly, there can be no assurance that a definitiv e a greement will be entered into or that the proposed Business Combination will be consummated. Forward looking statements . This presentation contains “forward looking statements” within the meaning of The Private Securities Litigation Reform Act of 1 995. Forward looking statements include, without limitation, statements regarding the estimated future financial performance, financial position and financial impacts of the Business Combination as well as of Landcadia, Hillman and the combined compan y f ollowing the Business Combination, the satisfaction of closing conditions to the Business Combination, the level of redemptio n b y Landcadia's public stockholders and purchase price adjustments in connection with the Business Combination, the timing of the completion of the Bus iness Combination, the anticipated pro forma enterprise value and projected revenue of the combined company following the Bus ine ss Combination, anticipated ownership percentages of the combined company's stockholders following the potential transaction, and the busines s s trategy, plans and objectives of management for future operations, including as they relate to the potential Business Combina tio n. Such statements can be identified by the fact that they do not relate strictly to historical or current facts. When used in this presentation, words su ch as “pro forma,” “anticipate,” “believe,” “continue,” “could,” “estimate,” “expect,” “intend,” “may,” “might,” “plan,” “pos sib le,” “potential,” “predict,” “project,” “should,” “strive,” “will”, “would” and similar expressions may identify forward looking statements, but the absence of these words doe s n ot mean that a statement is not forward looking. When Landcadia discusses its strategies or plans, including as they relate t o t he Business Combination, it is making projections, forecasts and forward looking statements. Such statements are based on the beliefs of, as well as assumpt ion s made by and information currently available to, Landcadia's management. These forward looking statements involve significant risks and uncertainties that could cause the actual results to differ ma ter ially from the expected results. Most of these factors are outside of Landcadia's and Hillman's control and are difficult to pre dict. Factors that may cause such differences include, but are not limited to: (1) Landcadia's ability to complete the Business Combination or, if Landcadia do es not complete the Business Combination, any other initial business combination; (2) satisfaction or waiver (if applicable ) of th e conditions to the Business Combination, including with respect to the approval of the stockholders of Landcadia; (3) the ability to maintain the listing of the combined company's securities on Nasdaq or another exchange; (4) the risk that the Business Combination disrupts current pl ans and operations of Landcadia or Hillman as a result of the announcement and consummation of the transaction described herein; (5) the impact of COVID - 19 on H illman’s business and operations and/or the ability of the parties to complete the Business Combination; (6) the ability to r eco gnize the anticipated benefits of the Business Combination, which may be affected by, among other things, competition, the ability of the combined company to g row and manage growth profitably, maintain relationships with customers and suppliers and retain its management and key employees ; (7) costs related to the Business Combination; (8) changes in applicable laws or regulations and delays in obtaining, adverse conditions contained in, or the inability to obtain necessary regulatory approvals required to complete the Business Combination; (9) the possibility tha t Hillman and Landcadia may be adversely affected by other economic, business, and/or competitive factors; (10) the out come of any legal proceedings that m ay be instituted against Landcadia, Hillman or any of their respective directors or officers following the announcement of the B usi ness Combination; (11) the failure to realize anticipated pro forma results and underlying assumptions, including with respect to estimated stockholder redempti ons and purchase price and other adjustments; and (12) other risks and uncertainties indicated from time to time in the prelimina ry proxy statement of Landcadia related to the Business Combination, including those under “Risk Factors” therein, and other documents filed or to be filed w ith the Securities and Exchange Commission (“SEC”) by Landcadia or Hillman. You are cautioned not to place undue reliance upon any forward looking statements. Forward looking statements included in thi s p resentation speak only as of the date of this presentation. Neither Landcadia nor Hillman undertakes any obligation to update it s forward looking statements to reflect events or circumstances after the date hereof. Additional risks and uncertainties are identified and discussed in Lan dca dia’s and Hillman’s reports filed with the SEC. No Offer or Solicitation . This presentation shall not constitute a solicitation of a proxy, consent or authorization with respect to any securities or in respect of the Business Combination. This presentation does not constitute, or form a part of, an offer to sell or the solici ta tion of an offer to sell or an offer to buy or the solicitation of an offer to buy any securities, and there shall be no sale of securities, in a ny jurisdiction in which such offer, solicitation or sale would be unlawful prior to registration or qualification under the sec uri ties laws of any such jurisdiction. No offer of securities shall be made except by means of a prospectus meeting the requirements of Section 10 of the Securities Act of 1933 , a s amended, and otherwise in accordance with applicable law. Use of Projections . This presentation contains financial forecasts. Neither Landcadia's nor Hillman's independent auditors have studied, reviewed , compiled or performed any procedures with respect to the projections for the purpose of their inclusion in this presentation, an d accordingly, neither of them has expressed an opinion or provided any other form of assurance with respect thereto for the purpose of this pr esentation. These projections are for illustrative purposes only and should not be relied upon as being necessarily indicativ e o f future results. In this presentation, certain of the above mentioned projected information has been provided for purposes of providing comparisons with historical dat a. The assumptions and estimates underlying the prospective financial information are inherently uncertain and are subject to a wide variety of significant business, economic and competitive risks and uncertainties that could cause actual results to differ materially from those co nta ined in the prospective financial information. Projections are inherently uncertain due to a number of factors outside of Lan dca dia's or Hillman's control. Accordingly, there can be no assurance that the prospective results are indicative of future performance of Landcadia, Hillma n o r the combined company after the Business Combination or that actual results will not differ materially from those presented in the prospective financial information. Inclusion of the prospective financial information in this presentation should not be regarded as a representati on by any person that the results contained in the prospective financial information will be achieved. Industry and Market Data . In this presentation, we rely on and refer to information and statistics regarding market participants in the sectors in whic h Hillman competes and other industry data. We obtained this information and statistics from third party sources, including rep ort s by market research firms and company filings. Being in receipt of the presentation you agree you may be restricted from dealing in (or enc ouraging others to deal in) price sensitive securities. Non - GAAP Financial Matters . This presentation includes certain non GAAP financial measures, including EBITDA, Adjusted EBITDA, Adjusted EBITDA Margin and fr ee cash flow. EBITDA is defined as net income plus tax expense, interest expense and depreciation and amortization. Adjusted EBITDA is defined as EBITDA, less non - recurring expenses. Free cash flow is defined as Adjusted EBITDA less capital exp enditures. Note that free cash flow does not represent residual cash flows available for discretionary expenditures due to th e f act that the measure does not deduct the payments required for debt service and other contractual obligations. These financial measures are not prepared in ac cordance with accounting principles generally accepted in the United States (“GAAP”) and may be different from non - GAAP financia l measures used by other companies. Landcadia and Hillman believe that the use of these non - GAAP financial measures provides an additional tool for inves tors to use in evaluating ongoing operating results and trends. These non - GAAP measures with comparable names should not be cons idered in isolation from, or as an alternative to, financial measures determined in accordance with GAAP. See the footnotes on the slides where t hes e measures are discussed for a description of these non - GAAP financial measures and reconciliations of such non - GAAP financial m easures to the most comparable GAAP amounts can be found. This presentation includes certain forward looking non - GAAP financial measures. To the ext ent a reconciliation of these forward - looking non - GAAP financial measures to the most directly comparable GAAP financial measure s is not provided in this presentation, it is because neither Landcadia nor Hillman is able to provide such reconciliation without unreasonable effort. Additional Information . Landcadia intends to file with the SEC a preliminary proxy statement in connection with the Business Combination and, when av ail able, will mail a definitive proxy statement and other relevant documents to its stockholders. The definitive proxy statement wi ll contain important information about the Business Combination and the other matters to be voted upon at a meeting of stockhold ers to be held to approve the Business Combination and other matters (the “Special Meeting”) and is not intended to provide the b as is for any investment decision or any other decision In respect of such matters. Landcadia’s stockholders and other interested persons are advised to read, when available, the preliminary proxy statement, the amendments thereto, and the definitive proxy statement in connecti on with Landcadia's solicitation of proxies for the Special Meeting because the proxy statement will contain important information about the Business Combination . W hen available, the definitive proxy statement will be mailed to Landcadia stockholders as of a record date to be established for voting on the Business Combination and the other matters to be voted upon at the Special Meeting. Landcadia’s stockholders will also be able to obta in copies of the proxy statement, without charge once available, at the SEC's website at www.sec.gov or by directing a request t o L andcadia’s secretary at 1510 West Loop South Houston, Texas 77027. Participants in the Solicitation . Landcadia, Hillman and their respective directors and officers may be deemed participants in the solicitation of proxies of L an dcadia stockholders in connection with the Business Combination. Landcadia’s stockholders and other interested persons may obtain, without charge, more detailed information regarding the directors and officers of Landcadia in Landcadia’s Registrati on Statement on Form S - 1, which was initially filed with the SEC on September 17, 2020 and is available at the SEC’s website at www .sec.gov or by directing a request to Landcadia’s secretary at the address above. Information regarding the persons who may, under SEC rules, be deemed par ticipants in the solicitation of proxies to Landcadia stockholders in connection with the Business Combination and other matt ers to be voted upon at the Special Meeting will be set forth in the proxy statement for the Business Combination when available. Additional information reg arding the interests of participants in the solicitation of proxies in connection with the Business Combination will be inclu ded in the proxy statement that Landcadia intends to file with the SEC, including Jefferies Financial Group Inc.’s and/or its affiliate’s various roles in th e t ransaction. You should keep in mind that the interest of participants in such solicitation of proxies may have financial inte res ts that are different from the interests of the other participants. Disclaimer
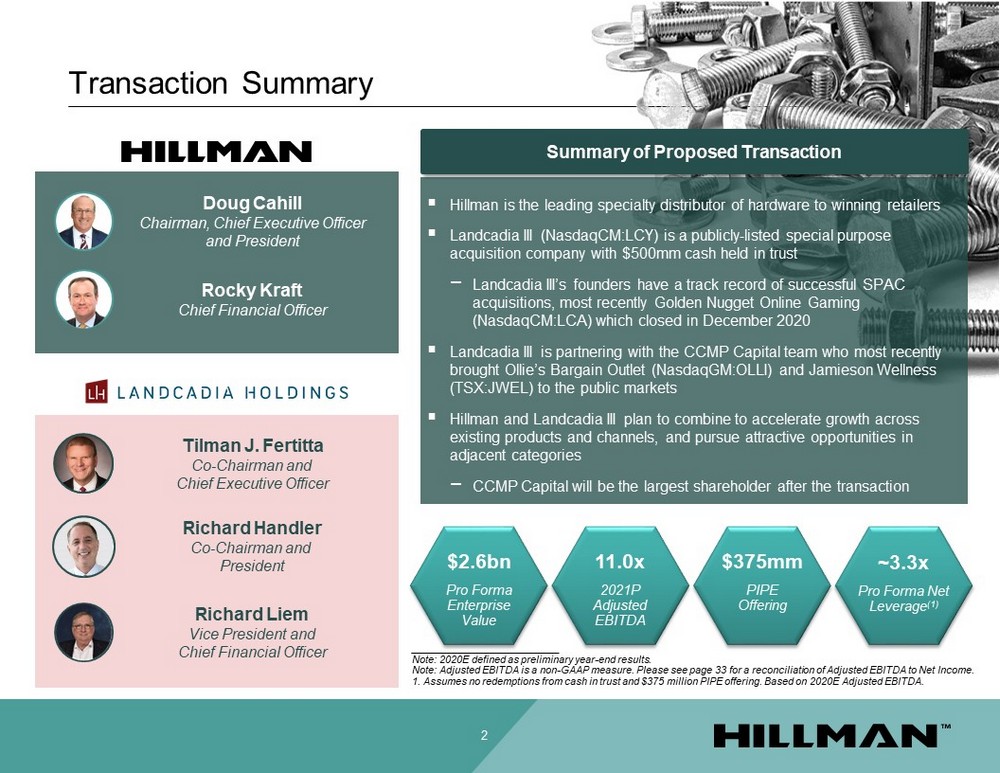
Transaction Summary 2 Doug Cahill Chairman, Chief Executive Officer and President Tilman J. Fertitta Co - Chairman and Chief Executive Officer Rocky Kraft Chief Financial Officer Richard Handler Co - Chairman and President Richard Liem Vice President and Chief Financial Officer ▪ Hillman is the leading specialty distributor of hardware to winning retailers ▪ Landcadia III (NasdaqCM:LCY) is a publicly - listed special purpose acquisition company with $500mm cash held in trust − Landcadia III’s founders have a track record of successful SPAC acquisitions, most recently Golden Nugget Online Gaming (NasdaqCM:LCA) which closed in December 2020 ▪ Landcadia III is p artnering with the CCMP Capital team who most recently brought Ollie’s Bargain Outlet (NasdaqGM:OLLI) and Jamieson Wellness (TSX:JWEL) to the public markets ▪ Hillman and Landcadia III plan to combine to accelerate growth across existing products and channels, and pursue attractive opportunities in adjacent categories − CCMP Capital will be the largest shareholder after the transaction Summary of Proposed Transaction __________________________ Note: 2020E defined as preliminary year - end results. Note: Adjusted EBITDA is a non - GAAP measure. Please see page 33 for a reconciliation of Adjusted EBITDA to Net Income. 1. Assumes no redemptions from cash in trust and $375 million PIPE offering. Based on 2020E Adjusted EBITDA. $2.6bn Pro Forma Enterprise Value 11.0x 2021P Adjusted EBITDA $375mm PIPE Offering ~3.3x Pro Forma Net Leverage (1)
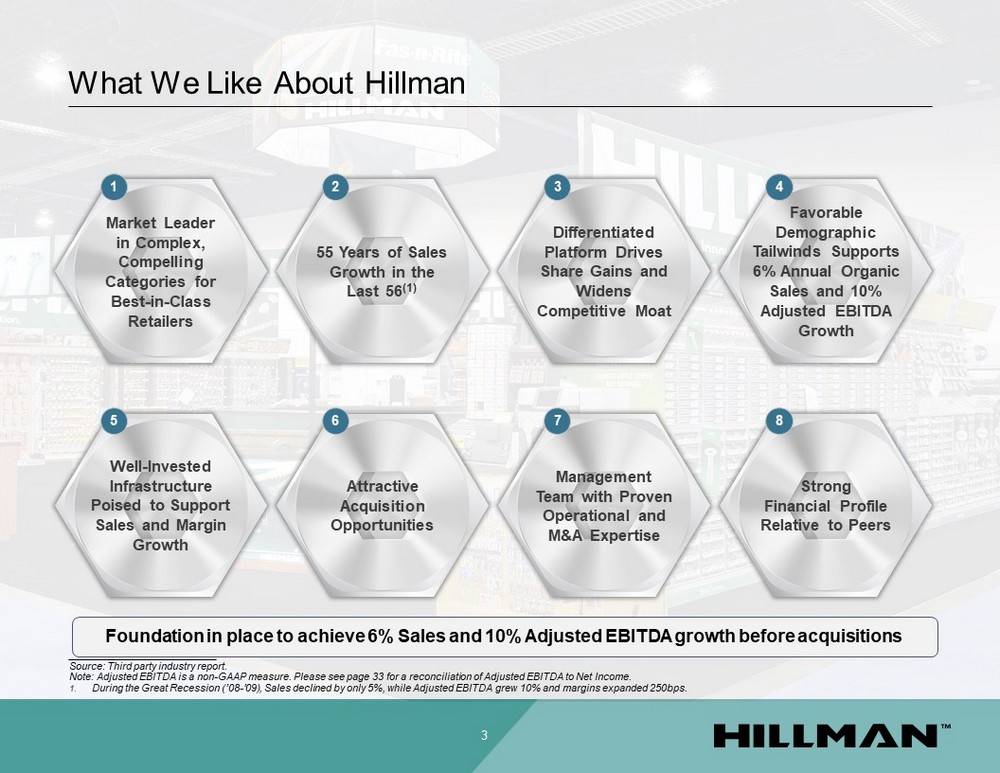
What We Like About Hillman 3 Foundation in place to achieve 6% Sales and 10% Adjusted EBITDA growth before acquisitions 1 Market Leader in Complex, Compelling Categories for Best - in - Class Retailers 2 55 Years of Sales Growth in the Last 56 (1) 3 Differentiated Platform Drives Share Gains and Widens Competitive Moat 4 Favorable Demographic Tailwinds Supports 6% Annual Organic Sales and 10% Adjusted EBITDA Growth 5 Well - Invested Infrastructure Poised to Support Sales and Margin Growth 6 Attractive Acquisition Opportunities 7 Management Team with Proven Operational and M&A Expertise 8 Strong Financial Profile Relative to Peers __________________________ Source: Third party industry report. Note: Adjusted EBITDA is a non - GAAP measure. Please see page 33 for a reconciliation of Adjusted EBITDA to Net Income. 1. During the Great Recession (’08 - ’09), Sales declined by only 5%, while Adjusted EBITDA grew 10% and margins expanded 250bps.
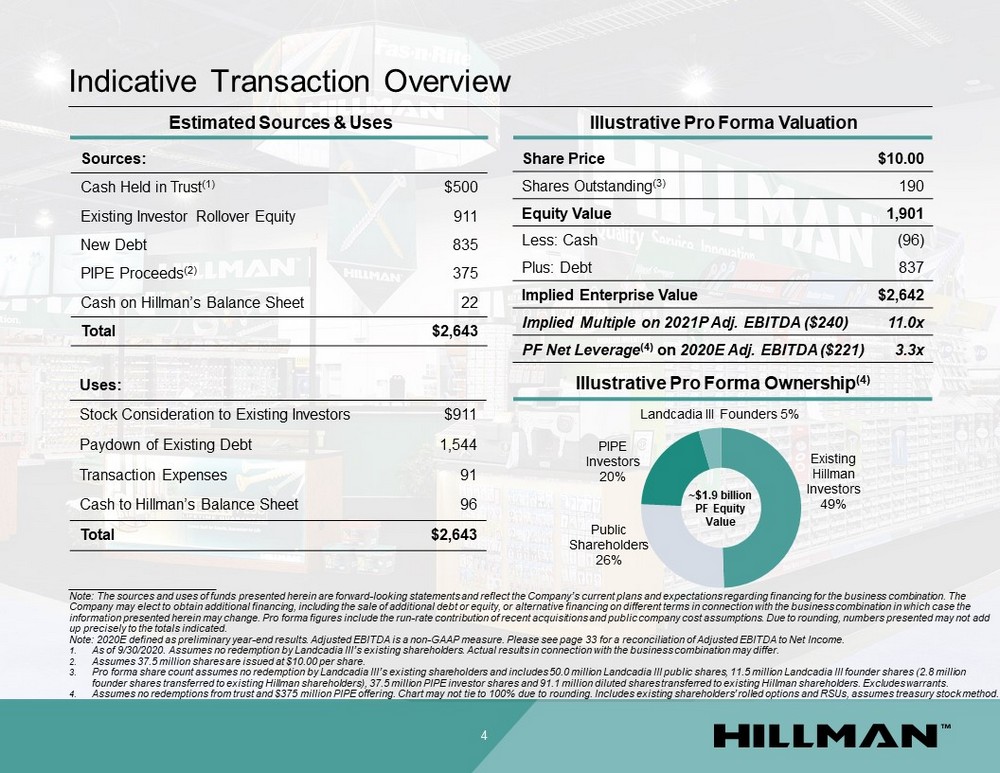
Illustrative Pro Forma Ownership (4) Indicative Transaction Overview Existing Hillman Investors 49% Public Shareholders 26% PIPE Investors 20% Landcadia III Founders 5% ~$1.9 billion PF Equity Value __________________________ Note: The sources and uses of funds presented herein are forward - looking statements and reflect the Company’s current plans and expectations regarding financing for the business combination. The Company may elect to obtain additional financing, including the sale of additional debt or equity, or alternative financing o n d ifferent terms in connection with the business combination in which case the information presented herein may change. Pro forma figures include the run - rate contribution of recent acquisitions and public c ompany cost assumptions. Due to rounding, numbers presented may not add up precisely to the totals indicated. Note: 2020E defined as preliminary year - end results. Adjusted EBITDA is a non - GAAP measure. Please see page 33 for a reconciliation of Adjusted EBITDA to Net Income. 1. As of 9/30/2020. Assumes no redemption by Landcadia III’s existing shareholders. Actual results in connection with the busine ss combination may differ. 2. Assumes 37.5 million shares are issued at $10.00 per share. 3. Pro forma share count assumes no redemption by Landcadia III’s existing shareholders and includes 50.0 million Landcadia III pub lic shares, 11.5 million Landcadia III founder shares (2.8 million founder shares transferred to existing Hillman shareholders), 37.5 million PIPE investor shares and 91.1 million diluted shar es transferred to existing Hillman shareholders. Excludes warrants. 4. Assumes no redemptions from trust and $375 million PIPE offering. Chart may not tie to 100% due to rounding. Includes existin g s hareholders’ rolled options and RSUs, assumes treasury stock method. 4 Uses: Stock Consideration to Existing Investors $911 Paydown of Existing Debt 1,544 Transaction Expenses 91 Cash to Hillman’s Balance Sheet 96 Total $2,643 Estimated Sources & Uses Illustrative Pro Forma Valuation Sources: Cash Held in Trust (1) $500 Existing Investor Rollover Equity 911 New Debt 835 PIPE Proceeds (2) 375 Cash on Hillman’s Balance Sheet 22 Total $2,643 Share Price $10.00 Shares Outstanding (3) 190 Equity Value 1,901 Less: Cash (96) Plus: Debt 837 Implied Enterprise Value $2,642 Implied Multiple on 2021P Adj. EBITDA ($240) 11.0x PF Net Leverage (4) on 2020E Adj. EBITDA ($221) 3.3x
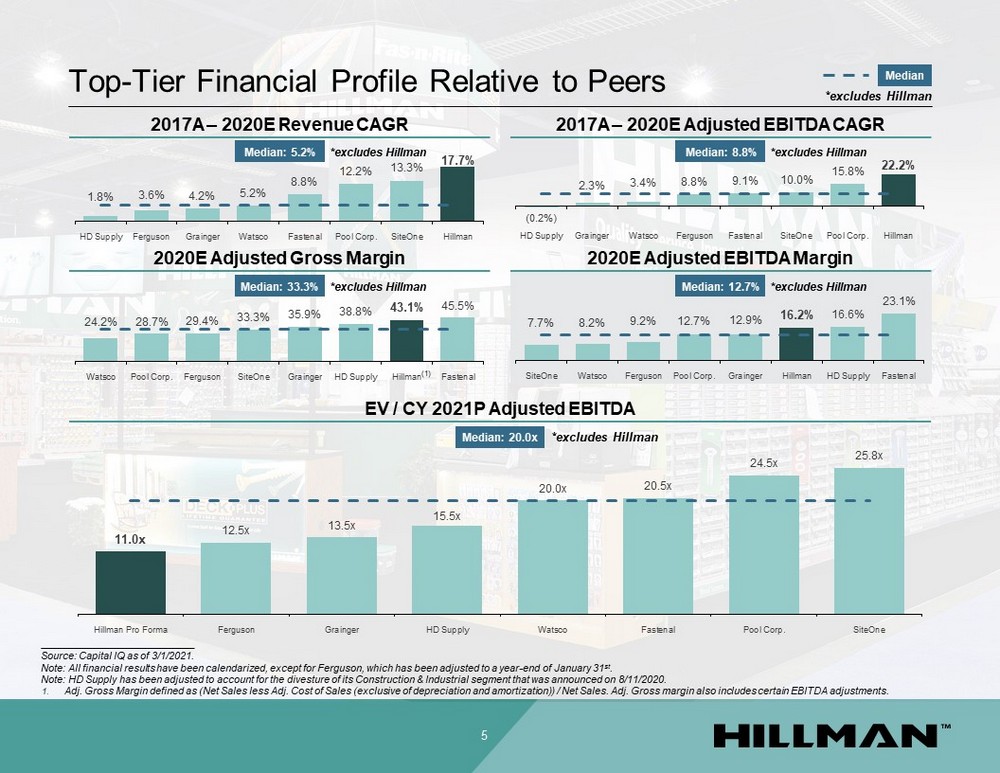
24.2% 28.7% 29.4% 33.3% 35.9% 38.8% 43.1% 45.5% Watsco Pool Corp. Ferguson SiteOne Grainger HD Supply Hillman Fastenal 11.0x 12.5x 13.5x 15.5x 20.0x 20.5x 24.5x 25.8x Hillman Pro Forma Ferguson Grainger HD Supply Watsco Fastenal Pool Corp. SiteOne Median: 12.7% Top - Tier Financial Profile Relative to Peers 2017A – 2020E Revenue CAGR Median: 5.2% 5 2017A – 2020E Adjusted EBITDA CAGR 2020E Adjusted Gross Margin 2020E Adjusted EBITDA Margin Median ___________________________ Source: Capital IQ as of 3/1/2021. Note: All financial results have been calendarized, except for Ferguson, which has been adjusted to a year - end of January 31 st . Note: HD Supply has been adjusted to account for the divesture of its Construction & Industrial segment that was announced on 8/ 11/2020. 1. Adj. Gross Margin defined as (Net Sales less Adj. Cost of Sales (exclusive of depreciation and amortization)) / Net Sales. Ad j. Gross margin also includes certain EBITDA adjustments. EV / CY 2021P Adjusted EBITDA (1) Median: 8.8% Median: 33.3% Median: 20.0x *excludes Hillman *excludes Hillman *excludes Hillman *excludes Hillman *excludes Hillman *excludes Hillman 1.8% 3.6% 4.2% 5.2% 8.8% 12.2% 13.3% 17.7% HD Supply Ferguson Grainger Watsco Fastenal Pool Corp. SiteOne Hillman (0.2%) 2.3% 3.4% 8.8% 9.1% 10.0% 15.8% 22.2% HD Supply Grainger Watsco Ferguson Fastenal SiteOne Pool Corp. Hillman 7.7% 8.2% 9.2% 12.7% 12.9% 16.2% 16.6% 23.1% SiteOne Watsco Ferguson Pool Corp. Grainger Hillman HD Supply Fastenal

The Hillman Group
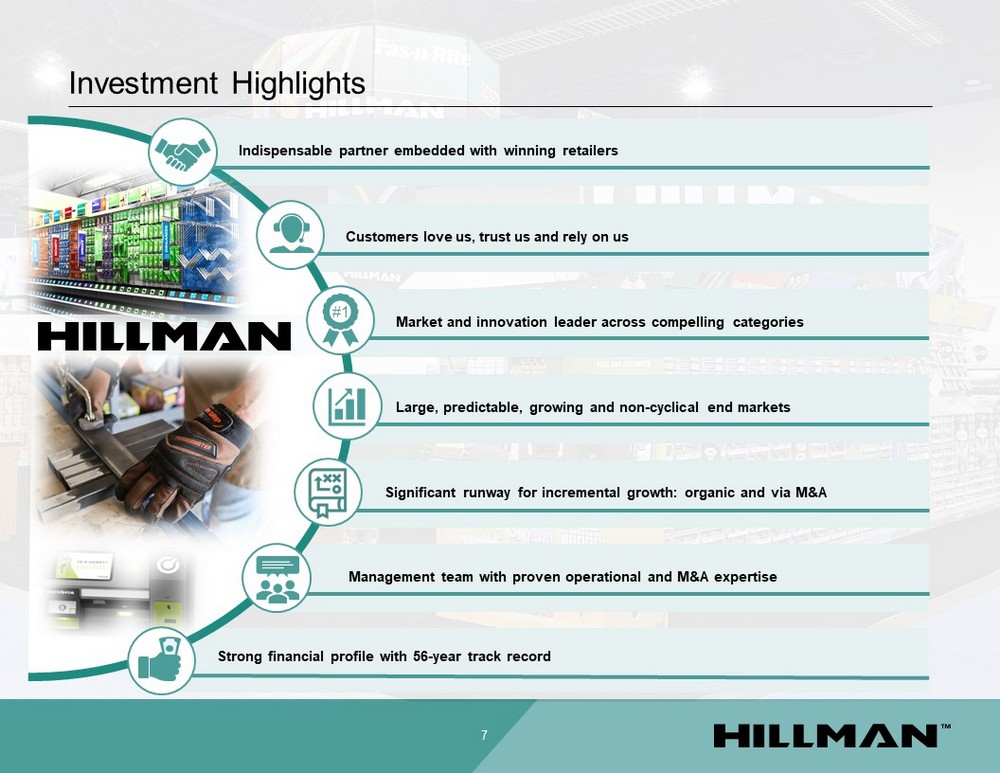
Significant runway for incremental growth: organic and via M&A Management team with proven operational and M&A expertise Strong financial profile with 56 - year track record Market and innovation leader across compelling categories Indispensable partner embedded with winning retailers Customers love us, trust us and rely on us Large, predictable, growing and non - cyclical end markets Investment Highlights 7 #1
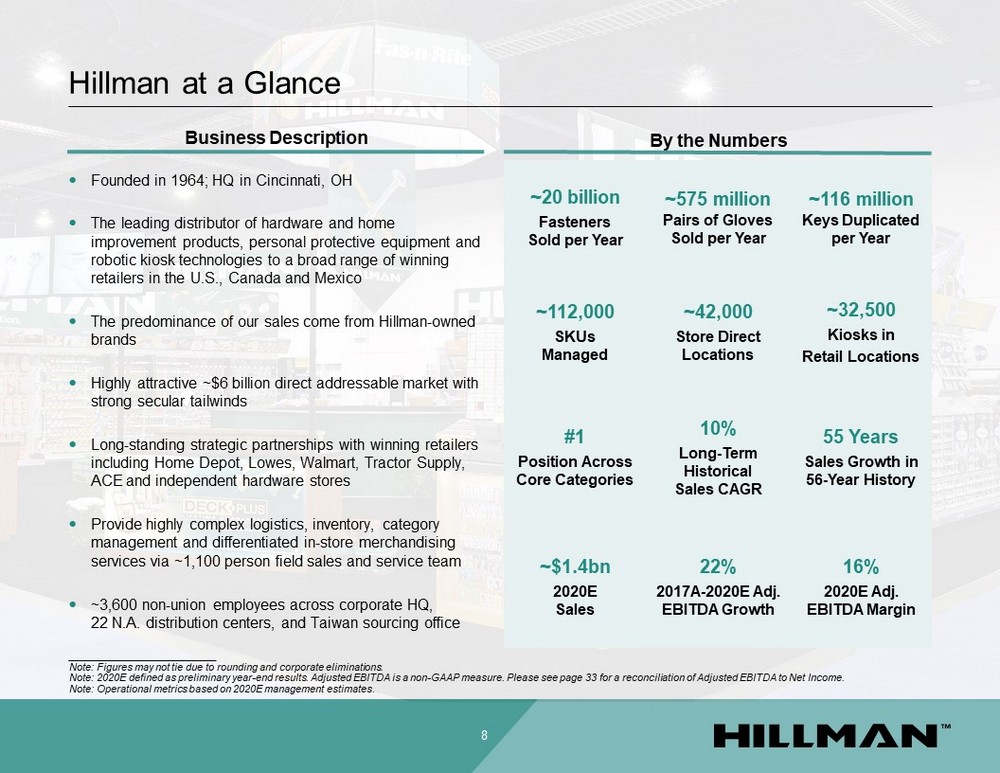
Hillman at a Glance 8 ; Founded in 1964; HQ in Cincinnati, OH ; The leading distributor of hardware and home improvement products, personal protective equipment and robotic kiosk technologies to a broad range of winning retailers in the U.S., Canada and Mexico ; The predominance of our sales come from Hillman - owned brands ; Highly attractive ~$6 billion direct addressable market with strong secular tailwinds ; Long - standing strategic partnerships with winning retailers including Home Depot, Lowes, Walmart, Tractor Supply, ACE and independent hardware stores ; Provide highly complex logistics, inventory, category management and differentiated in - store merchandising services via ~1,100 person field sales and service team ; ~3,600 non - union employees across corporate HQ, 22 N.A. distribution centers, and Taiwan sourcing office __________________________ Note: Figures may not tie due to rounding and corporate eliminations. Note: 2020E defined as preliminary year - end results. Adjusted EBITDA is a non - GAAP measure. Please see page 33 for a reconciliat ion of Adjusted EBITDA to Net Income. Note: Operational metrics based on 2020E management estimates. By the Numbers ~20 billion Fasteners Sold per Year ~575 million Pairs of Gloves Sold per Year ~116 million Keys Duplicated per Year ~112,000 SKUs Managed ~42,000 Store Direct Locations ~32,500 Kiosks in Retail Locations #1 Position Across Core Categories 10% Long - Term Historical Sales CAGR 55 Years Sales Growth in 56 - Year History ~$1.4bn 2020E Sales 22% 2017A - 2020E Adj. EBITDA Growth 16% 2020E Adj. EBITDA Margin Business Description
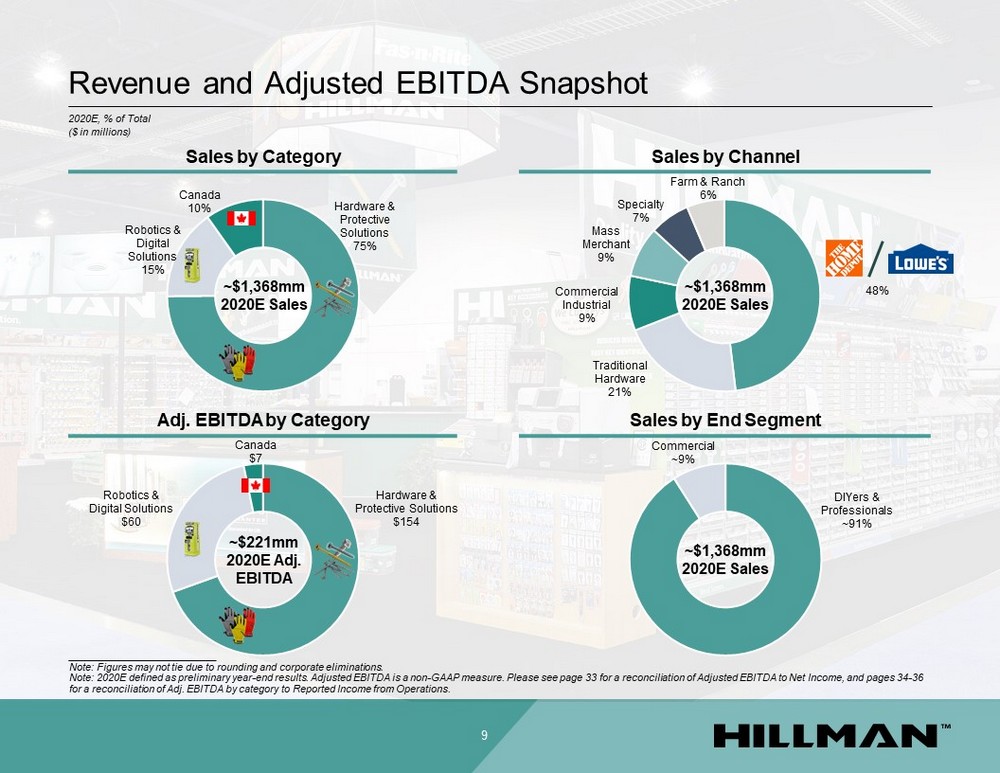
Revenue and Adjusted EBITDA Snapshot 9 2020E, % of Total ($ in millions) __________________________ Note: Figures may not tie due to rounding and corporate eliminations. Note: 2020E defined as preliminary year - end results. Adjusted EBITDA is a non - GAAP measure. Please see page 33 for a reconciliat ion of Adjusted EBITDA to Net Income, and pages 34 - 36 for a reconciliation of Adj. EBITDA by category to Reported Income from Operations. Sales by Category Sales by Channel Sales by End Segment Adj. EBITDA by Category Hardware & Protective Solutions 75% Robotics & Digital Solutions 15% Canada 10% ~$1,368mm 2020E Sales DIYers & Professionals ~ 91% Commercial ~ 9% ~$1,368mm 2020E Sales 48% Traditional Hardware 21% Commercial Industrial 9% Mass Merchant 9% Specialty 7% Farm & Ranch 6% Hardware & Protective Solutions $154 Robotics & Digital Solutions $60 Canada $7 ~$1,368mm 2020E Sales ~$221mm 2020E Adj. EBITDA
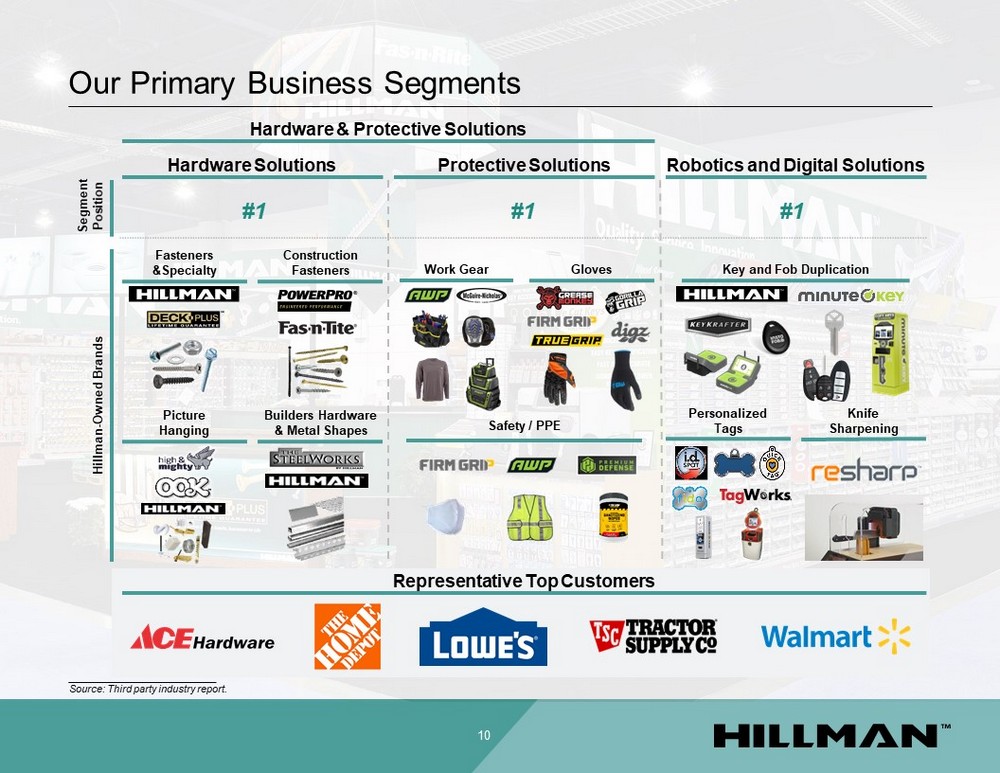
10 Segment Position #1 #1 #1 Hardware Solutions Protective Solutions Robotics and Digital Solutions Our Primary Business Segments Key and Fob Duplication Personalized Tags Knife Sharpening Fasteners &Specialty Gloves Builders Hardware & Metal Shapes Safety / PPE Construction Fasteners Work Gear Picture Hanging __________________________ Source: Third party industry report. Hardware & Protective Solutions Hillman - Owned Brands Representative Top Customers
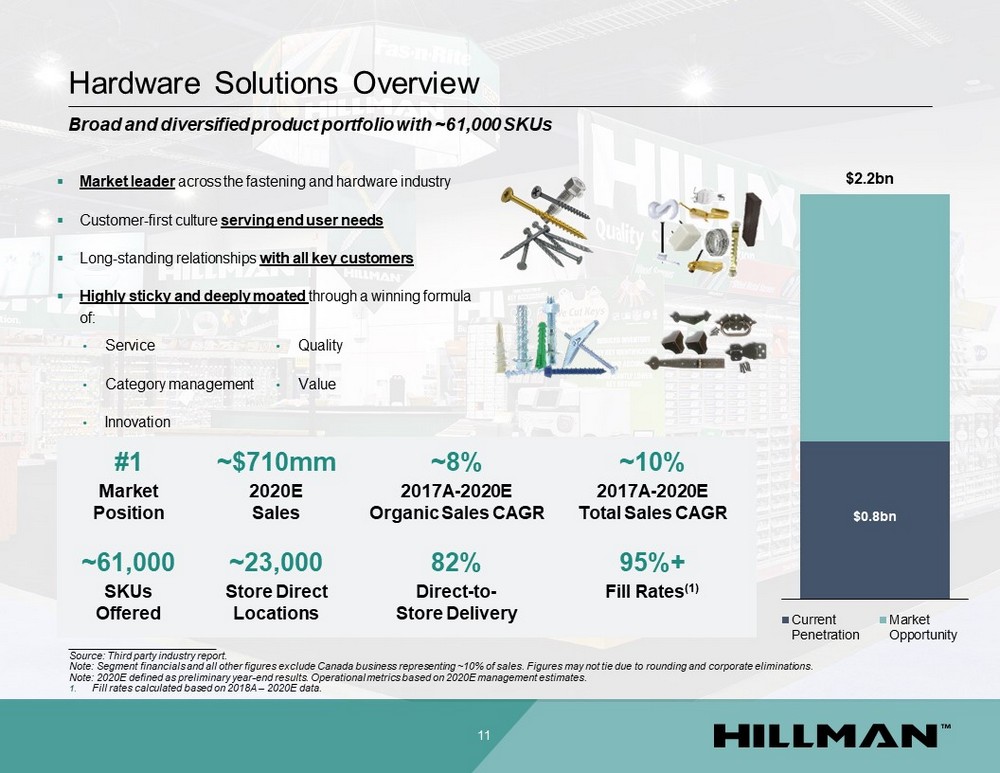
Hardware Solutions Overview 11 Broad and diversified product portfolio with ~61,000 SKUs ▪ Market leader across the fastening and hardware industry ▪ Customer - first culture serving end user needs ▪ Long - standing relationships with all key customers ▪ Highly sticky and deeply moated through a winning formula of: • Service • Category management • Innovation ~23,000 Store Direct Locations ~$710mm 2020E Sales ~61,000 SKUs Offered #1 Market Position 82% Direct - to - Store Delivery ~8% 2017A - 2020E Organic Sales CAGR $0.8bn Current Penetration Market Opportunity $2.2bn • Quality • Value 95%+ Fill Rates (1) ~10% 2017A - 2020E Total Sales CAGR __________________________ Source: Third party industry report. Note: Segment financials and all other figures exclude Canada business representing ~10% of sales. Figures may not tie due to ro unding and corporate eliminations. Note: 2020E defined as preliminary year - end results. Operational metrics based on 2020E management estimates. 1. Fill rates calculated based on 2018A – 2020E data.
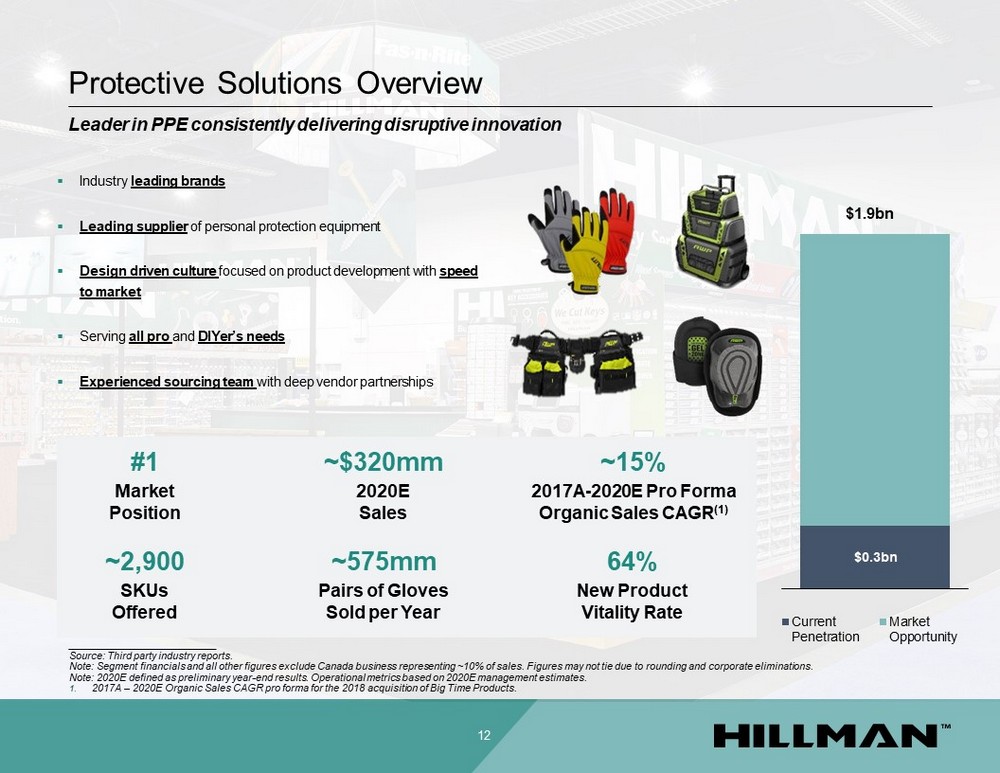
Protective Solutions Overview 12 Leader in PPE consistently delivering disruptive innovation ▪ Industry leading brands ▪ Leading supplier of personal protection equipment ▪ Design driven culture focused on product development with speed to market ▪ Serving all pro and DIYer’s needs ▪ Experienced sourcing team with deep vendor partnerships $1.9bn $0.3 bn Current Penetration Market Opportunity 64% New Product Vitality Rate ~575mm Pairs of Gloves Sold per Year ~2,900 SKUs Offered ~$320mm 2020E Sales #1 Market Position ~15% 2017A - 2020E Pro Forma Organic Sales CAGR (1) __________________________ Source: Third party industry reports. Note: Segment financials and all other figures exclude Canada business representing ~10% of sales. Figures may not tie due to ro unding and corporate eliminations. Note: 2020E defined as preliminary year - end results. Operational metrics based on 2020E management estimates. 1. 2017A – 2020E Organic Sales CAGR pro forma for the 2018 acquisition of Big Time Products.
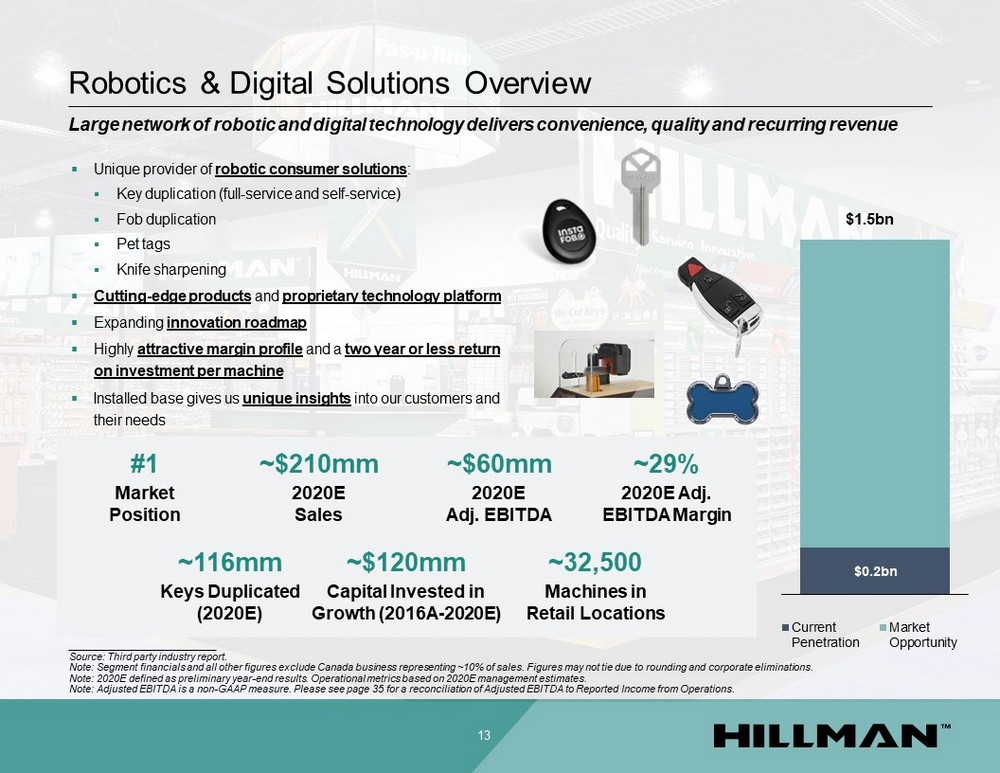
▪ Unique provider of robotic consumer solutions : ▪ Key duplication (full - service and self - service) ▪ Fob duplication ▪ Pet tags ▪ Knife sharpening ▪ Cutting - edge products and proprietary technology platform ▪ Expanding innovation roadmap ▪ Highly attractive margin profile and a two year or less return on investment per machine ▪ Installed base gives us unique insights into our customers and their needs Robotics & Digital Solutions Overview 13 ~116mm Keys Duplicated (2020E) Large network of robotic and digital technology delivers convenience, quality and recurring revenue #1 Market Position ~$210mm 2020E Sales ~$120mm Capital Invested in Growth (2016A - 2020E) ~$60mm 2020E Adj. EBITDA __________________________ Source: Third party industry report. Note: Segment financials and all other figures exclude Canada business representing ~10% of sales. Figures may not tie due to ro unding and corporate eliminations. Note: 2020E defined as preliminary year - end results. Operational metrics based on 2020E management estimates. Note: Adjusted EBITDA is a non - GAAP measure. Please see page 35 for a reconciliation of Adjusted EBITDA to Reported Income from Operations. ~32,500 Machines in Retail Locations ~29% 2020E Adj. EBITDA Margin $0.2 bn Current Penetration Market Opportunity $1.5bn
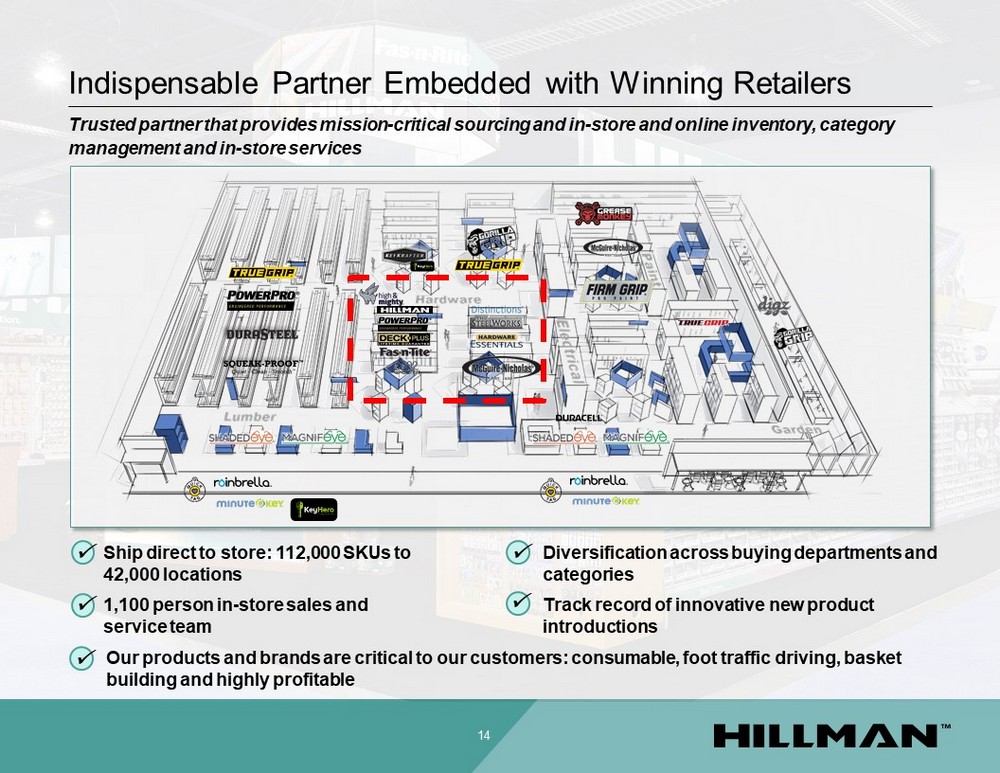
Indispensable Partner Embedded with Winning Retailers Trusted partner that provides mission - critical sourcing and in - store and online inventory, category management and in - store services 14 Our products and brands are critical to our customers: consumable, foot traffic driving, basket building and highly profitable 1,100 person in - store sales and service team Track record of innovative new product introductions Diversification across buying departments and categories Ship direct to store: 112,000 SKUs to 42,000 locations
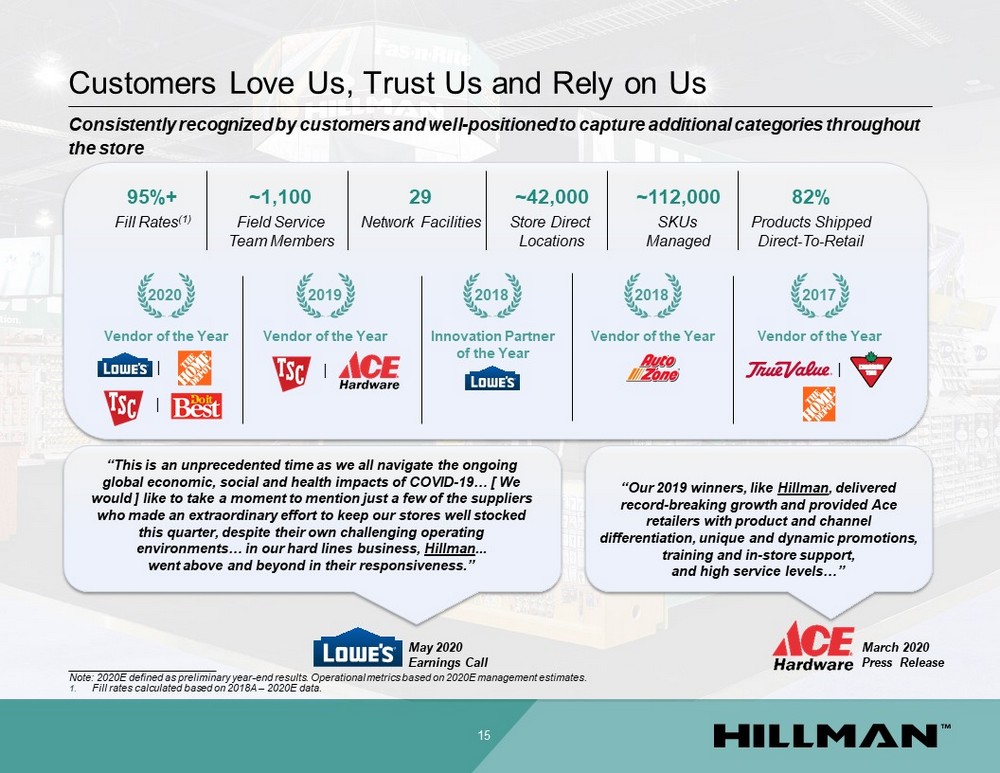
Customers Love Us, Trust Us and Rely on Us 15 “This is an unprecedented time as we all navigate the ongoing global economic, social and health impacts of COVID - 19… [ We would ] like to take a moment to mention just a few of the suppliers who made an extraordinary effort to keep our stores well stocked this quarter, despite their own challenging operating environments… in our hard lines business, Hillman ... went above and beyond in their responsiveness.” “Our 2019 winners, like Hillman , delivered record - breaking growth and provided Ace retailers with product and channel differentiation, unique and dynamic promotions, training and in - store support, and high service levels…” May 2020 Earnings Call March 2020 Press Release Innovation Partner of the Year 2018 Vendor of the Year 2019 | 2018 Vendor of the Year | 2017 Vendor of the Year Vendor of the Year 2020 | | ~1,100 Field Service Team Members 95%+ Fill Rates (1) ~42,000 Store Direct Locations ~112,000 SKUs Managed 29 Network Facilities 82% Products Shipped Direct - To - Retail Consistently recognized by customers and well - positioned to capture additional categories throughout the store __________________________ Note: 2020E defined as preliminary year - end results. Operational metrics based on 2020E management estimates. 1. Fill rates calculated based on 2018A – 2020E data.
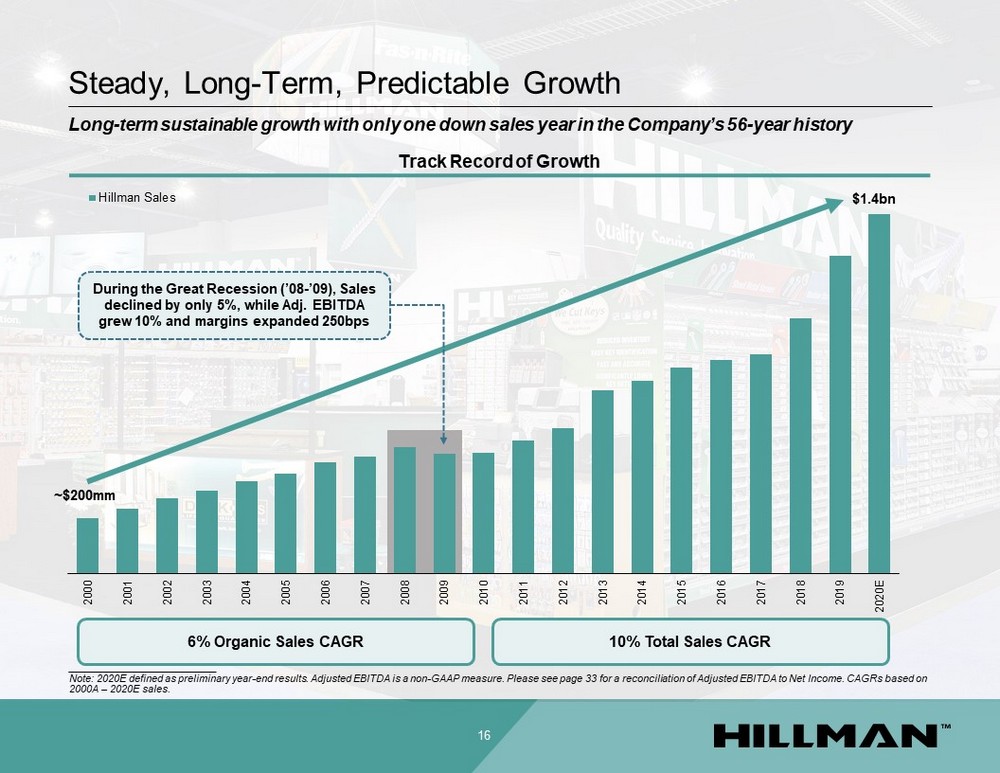
2000 2001 2002 2003 2004 2005 2006 2007 2008 2009 2010 2011 2012 2013 2014 2015 2016 2017 2018 2019 2020E Hillman Sales $1.4bn Steady, Long - Term, Predictable Growth ~$ 200 mm Track Record of Growth 10 % Total Sales CAGR 16 6 % Organic Sales CAGR During the Great Recession (’08 - ’09), Sales declined by only 5%, while Adj. EBITDA grew 10% and margins expanded 250bps Long - term sustainable growth with only one down sales year in the Company’s 56 - year history __________________________ Note: 2020E defined as preliminary year - end results. Adjusted EBITDA is a non - GAAP measure. Please see page 33 for a reconciliat ion of Adjusted EBITDA to Net Income. CAGRs based on 2000A – 2020E sales.

Multiple Levers to Drive Growth
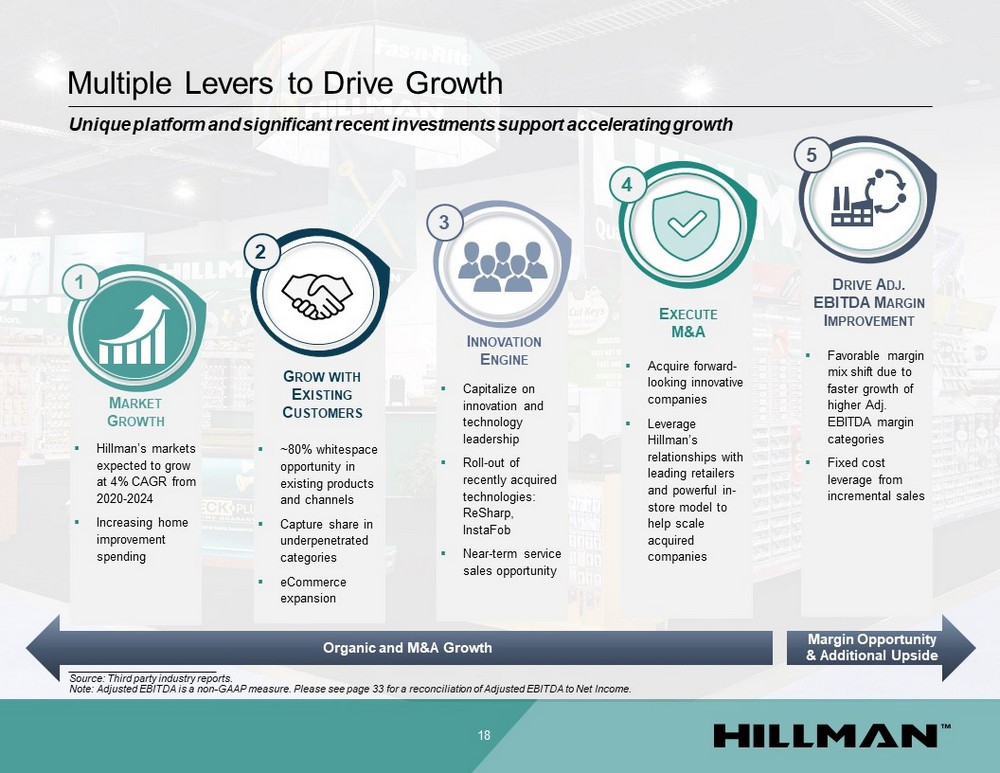
▪ Hillman’s markets expected to grow at 4% CAGR from 2020 - 2024 ▪ Increasing home improvement spending ▪ Acquire forward - looking innovative companies ▪ Leverage Hillman’s relationships with leading retailers and powerful in - store model to help scale acquired companies ▪ Capitalize on innovation and technology leadership ▪ Roll - out of recently acquired technologies: ReSharp, InstaFob ▪ Near - term service sales opportunity ▪ Favorable margin mix shift due to faster growth of higher Adj. EBITDA margin categories ▪ Fixed cost leverage from incremental sales ▪ ~80% whitespace opportunity in existing products and channels ▪ Capture share in underpenetrated categories ▪ eCommerce expansion Multiple Levers to Drive Growth 18 Organic and M&A Growth Margin Opportunity & Additional Upside Unique platform and significant recent investments support accelerating growth __________________________ Source: Third party industry reports. Note: Adjusted EBITDA is a non - GAAP measure. Please see page 33 for a reconciliation of Adjusted EBITDA to Net Income. D RIVE A DJ . EBITDA M ARGIN I MPROVEMENT 5 E XECUTE M&A 4 I NNOVATION E NGINE 3 G ROW WITH E XISTING C USTOMERS 2 M ARKET G ROWTH 1
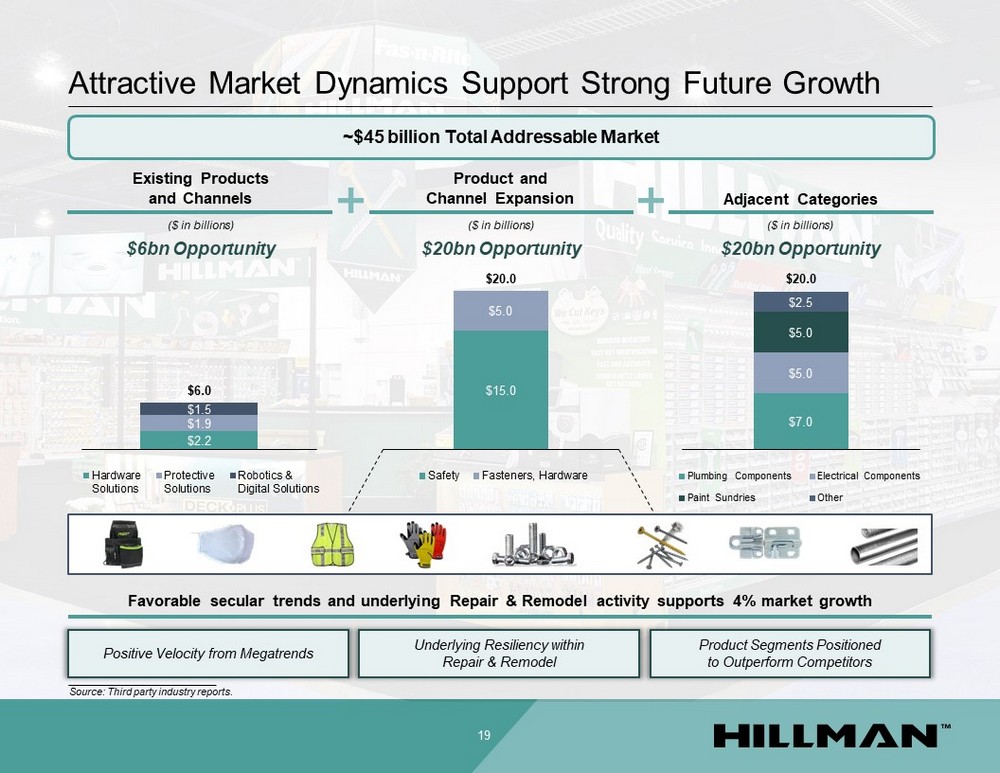
Attractive Market Dynamics Support Strong Future Growth Existing Products and Channels Adjacent Categories Product and Channel Expansion ($ in billions) ($ in billions) ($ in billions) __________________________ Source: Third party industry reports. 19 Favorable secular trends and underlying Repair & Remodel activity supports 4% market growth Underlying Resiliency within Repair & Remodel Product Segments Positioned to Outperform Competitors Positive Velocity from Megatrends $6bn Opportunity $20bn Opportunity $20bn Opportunity $2.2 $1.9 $1.5 $6.0 Hardware Solutions Protective Solutions Robotics & Digital Solutions $15.0 $5.0 $20.0 Safety Fasteners, Hardware $7.0 $5.0 $5.0 $2.5 $20.0 Other Paint Sundries Electrical Components Plumbing Components ~$45 billion Total Addressable Market
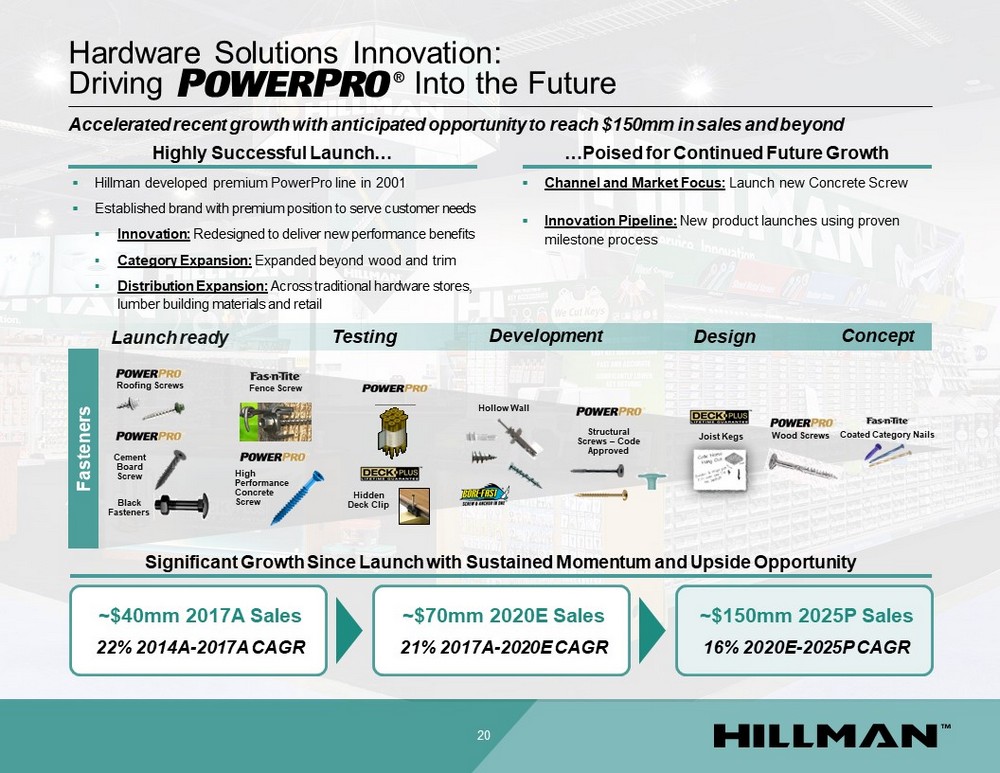
Hardware Solutions Innovation: Driving Into the Future 20 Highly Successful Launch… …Poised for Continued Future Growth Significant Growth Since Launch with Sustained Momentum and Upside Opportunity ▪ Hillman developed premium PowerPro line in 2001 ▪ Established brand with premium position to serve customer needs ▪ Innovation: Redesigned to deliver new performance benefits ▪ Category Expansion: Expanded beyond wood and trim ▪ Distribution Expansion: Across traditional hardware stores, lumber building materials and retail ▪ Channel and Market Focus: Launch new Concrete Screw ▪ Innovation Pipeline: New product launches using proven milestone process ~$70mm 2020E Sales 21% 2017A - 2020E CAGR ~$40mm 2017A Sales 22% 2014A - 2017A CAGR Launch ready Roofing Screws Cement Board Screw Black Fasteners Fence Screw Hidden Deck Clip High Performance Concrete Screw Wood Screws Structural Screws – Code Approved Joist Kegs Coated Category Nails Fasteners Hollow Wall Testing Development Design Concept ~$150mm 2025P Sales 16% 2020E - 2025P CAGR Accelerated recent growth with anticipated opportunity to reach $150mm in sales and beyond

Case Study: User - Driven Innovation… 21 Through extensive in - field research, Protective Solutions develops patent protected products that resonate with the core consumer Floating TPR Protection Geometric Hi - Density Foam Athletic Wrist Athletic Wrist Ergonomic Palm Design Extended Thumb Saddle Durable Duck Canvas Continuous Lycra Stretch Panels Reinforced Finger Design PU Grip Zones Dual Impact Zone Protection Maximum Dexterity Palm Design #1 in Unaided Awareness in Category x Doubled Sales in 3 Years x From Gloves to Work Gear to Safety: Extendable x Collaborative Partnership vs. Big Brand Tension x …Creates Growth and Opportunity for Hillman
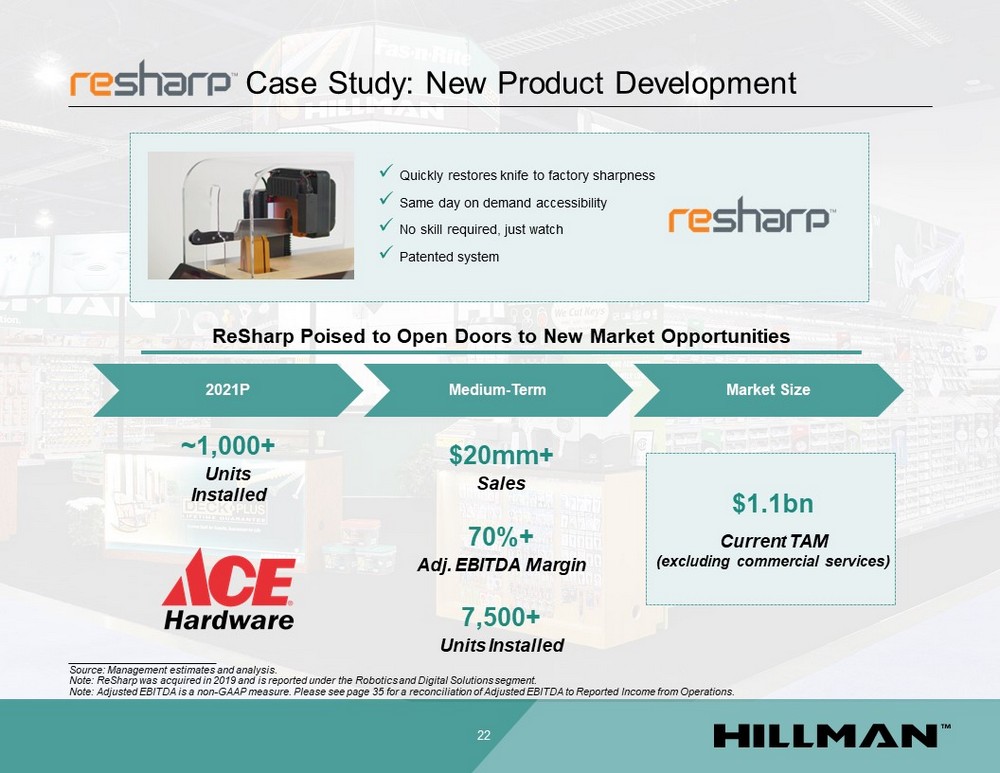
Case Study: New Product Development 22 __________________________ Source: Management estimates and analysis. Note: ReSharp was acquired in 2019 and is reported under the Robotics and Digital Solutions segment. Note: Adjusted EBITDA is a non - GAAP measure. Please see page 35 for a reconciliation of Adjusted EBITDA to Reported Income from Operations. ReSharp Poised to Open Doors to New Market Opportunities ~1,000+ Units Installed 70%+ Adj. EBITDA Margin $1.1bn Current TAM (excluding commercial services) 2021P Medium - Term Market Size x Quickly restores knife to factory sharpness x Same day on demand accessibility x No skill required, just watch x Patented system 7,500+ Units Installed $20mm+ Sales
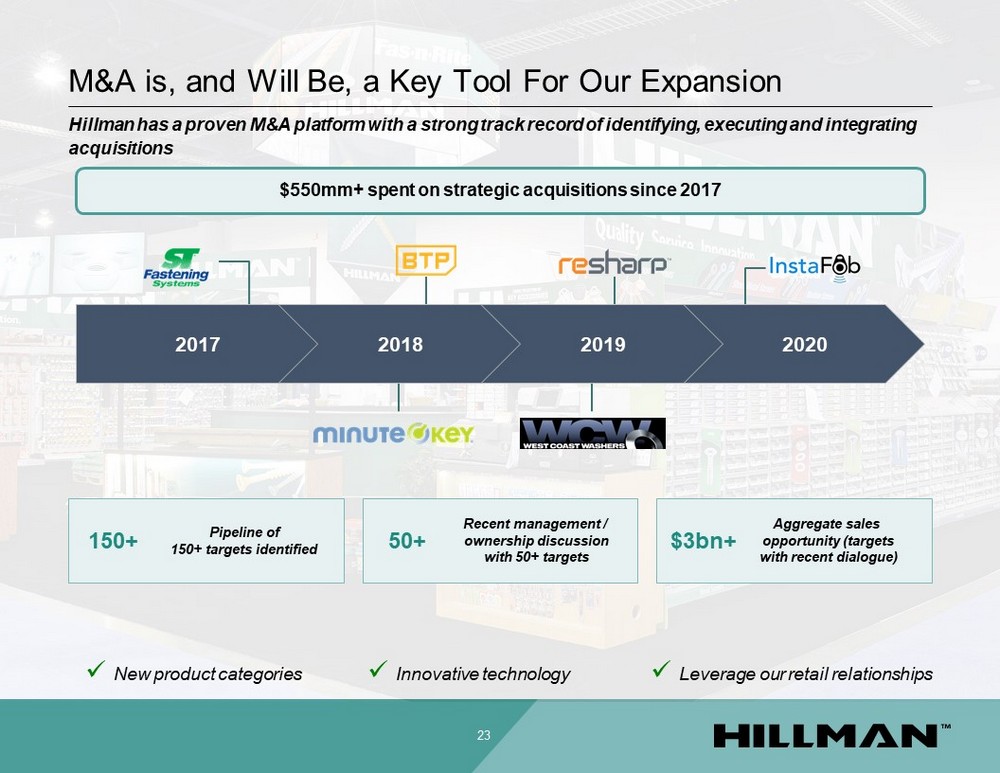
23 M&A is, and Will Be, a Key Tool For Our Expansion 2020 2019 2018 2017 $550mm+ spent on strategic acquisitions since 2017 x New product categories x Innovative technology x Leverage our retail relationships Hillman has a proven M&A platform with a strong track record of identifying, executing and integrating acquisitions 150+ Pipeline of 150+ targets identified 50+ Recent management / ownership discussion with 50+ targets $3bn+ Aggregate sales opportunity (targets with recent dialogue)
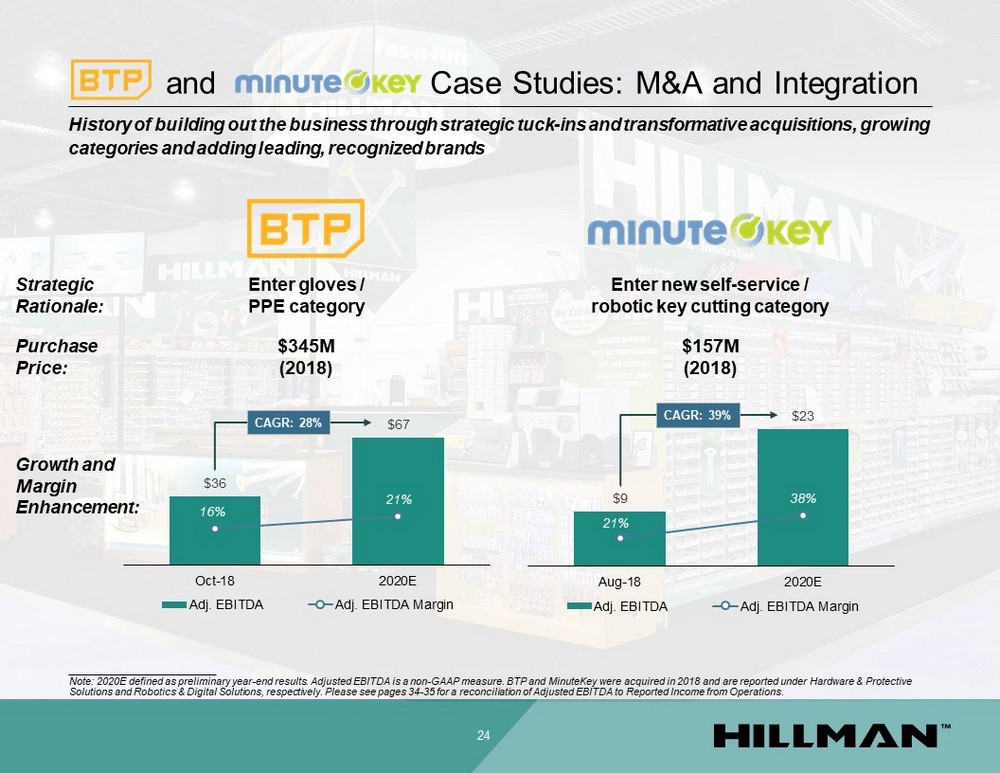
and Case Studies: M&A and Integration 24 Strategic Rationale: Purchase Price: Enter gloves / PPE category $36 $67 16% 21% Oct-18 2020E Adj. EBITDA Adj. EBITDA Margin $345M (2018) CAGR: 28% Growth and Margin Enhancement: History of building out the business through strategic tuck - ins and transformative acquisitions, growing categories and adding leading, recognized brands Enter new self - service / robotic key cutting category $157M (2018) $9 $23 21% 38% Aug-18 2020E Adj. EBITDA Adj. EBITDA Margin CAGR: 39% __________________________ Note: 2020E defined as preliminary year - end results. Adjusted EBITDA is a non - GAAP measure. BTP and MinuteKey were acquired in 2 018 and are reported under Hardware & Protective Solutions and Robotics & Digital Solutions, respectively. Please see pages 34 - 35 for a reconciliation of Adjusted EBITDA to Repo rted Income from Operations.
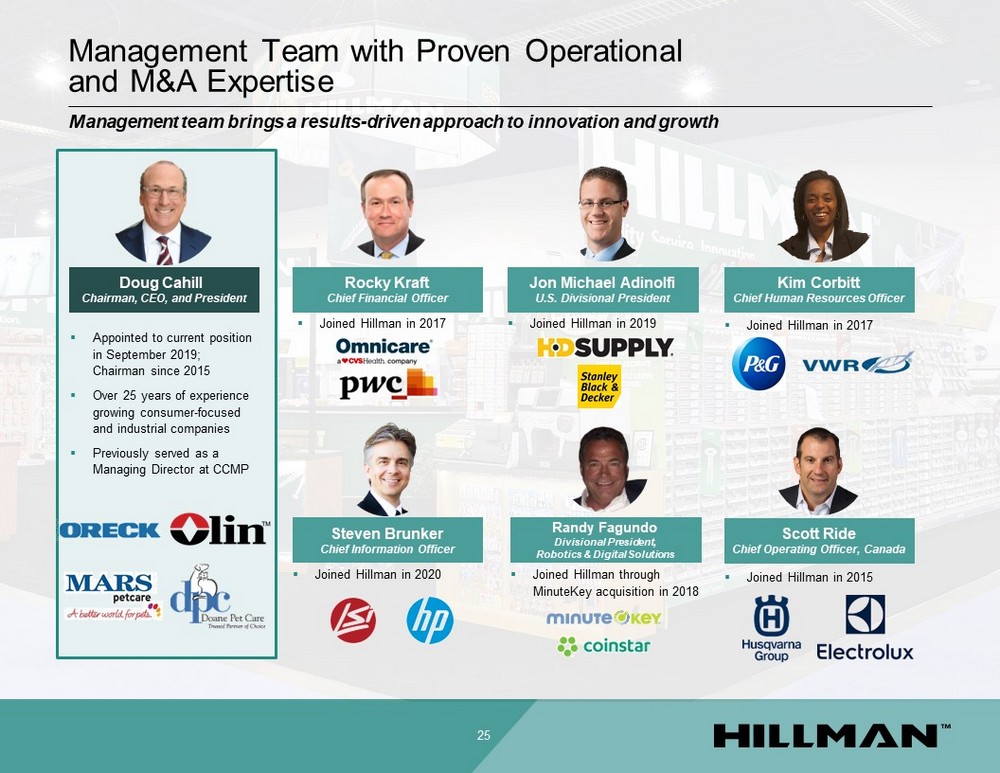
Management Team with Proven Operational and M&A Expertise 25 Management team brings a results - driven approach to innovation and growth ▪ Appointed to current position in September 2019; Chairman since 2015 ▪ Over 25 years of experience growing consumer - focused and industrial companies ▪ Previously served as a Managing Director at CCMP ▪ Joined Hillman in 2017 ▪ Joined Hillman in 2020 ▪ Joined Hillman through MinuteKey acquisition in 2018 Rocky Kraft Chief Financial Officer Steven Brunker Chief Information Officer Randy Fagundo Divisional President, Robotics & Digital Solutions Doug Cahill Chairman, C EO, and President Jon Michael Adinolfi U.S. Divisional President ▪ Joined Hillman in 2019 Kim Corbitt Chief Human Resources Officer ▪ Joined Hillman in 2015 Scott Ride Chief Operating Officer, Canada ▪ Joined Hillman in 2017

Financial Overview
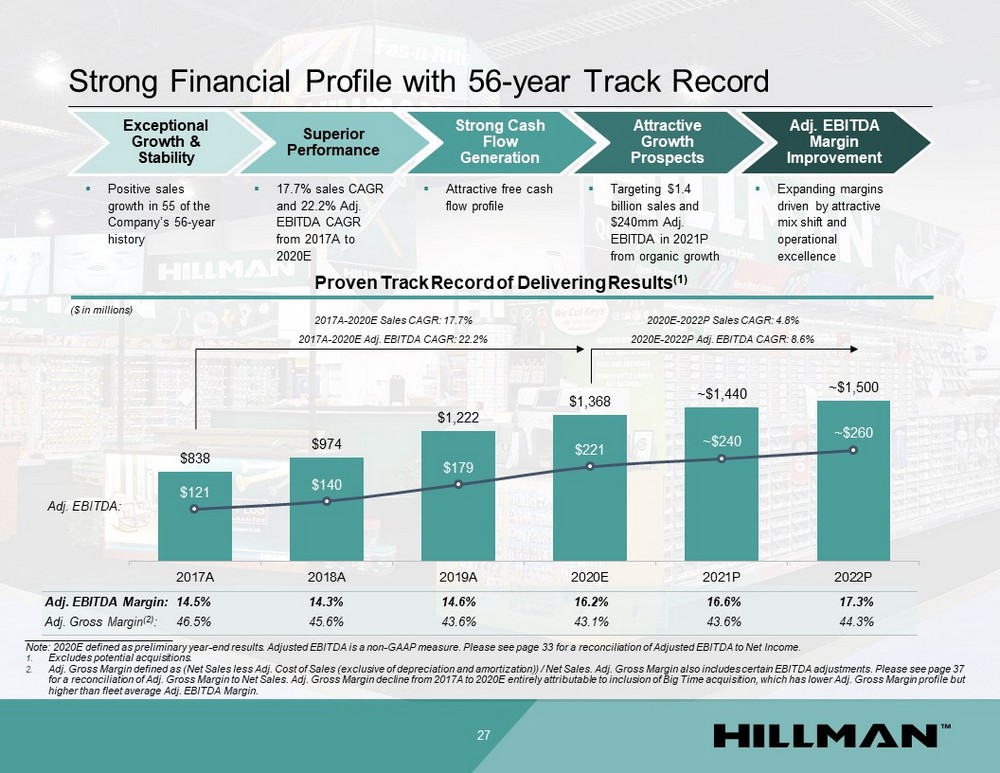
Strong Financial Profile with 56 - year Track Record 27 ($ in millions) Proven Track Record of Delivering Results (1) Exceptional Growth & Stability Superior Performance Strong Cash Flow Generation Attractive Growth Prospects Adj. EBITDA Margin Improvement ▪ 17.7% sales CAGR and 22.2% Adj. EBITDA CAGR from 2017A to 2020E ▪ Positive sales growth in 55 of the Company’s 56 - year history ▪ Attractive free cash flow profile ▪ Targeting $1.4 billion sales and $240mm Adj. EBITDA in 2021P from organic growth ▪ Expanding margins driven by attractive mix shift and operational excellence $838 $974 $1,222 $1,368 ~$1,440 ~$1,500 $121 $140 $179 $221 ~$240 ~$260 2017A 2018A 2019A 2020E 2021P 2022P Adj. EBITDA: 2017A - 2020E Adj. EBITDA CAGR: 22.2% 2017A - 2020E Sales CAGR: 17.7% __________________________ Note: 2020E defined as preliminary year - end results. Adjusted EBITDA is a non - GAAP measure. Please see page 33 for a reconciliat ion of Adjusted EBITDA to Net Income. 1. Excludes potential acquisitions. 2. Adj. Gross Margin defined as (Net Sales less Adj. Cost of Sales (exclusive of depreciation and amortization)) / Net Sales. Ad j. Gross Margin also includes certain EBITDA adjustments. Please see page 37 for a reconciliation of Adj. Gross Margin to Net Sales. Adj. Gross Margin decline from 2017A to 2020E entirely attributable t o i nclusion of Big Time acquisition, which has lower Adj. Gross Margin profile but higher than fleet average Adj. EBITDA Margin. Adj. EBITDA Margin: 14.5% 14.3% 14.6% 16.2% 16.6% 17.3% Adj. Gross Margin (2) : 46.5% 45.6% 43.6% 43.1% 43.6% 44.3% 2020E - 2022P Adj. EBITDA CAGR: 8.6% 2020E - 2022P Sales CAGR: 4.8%
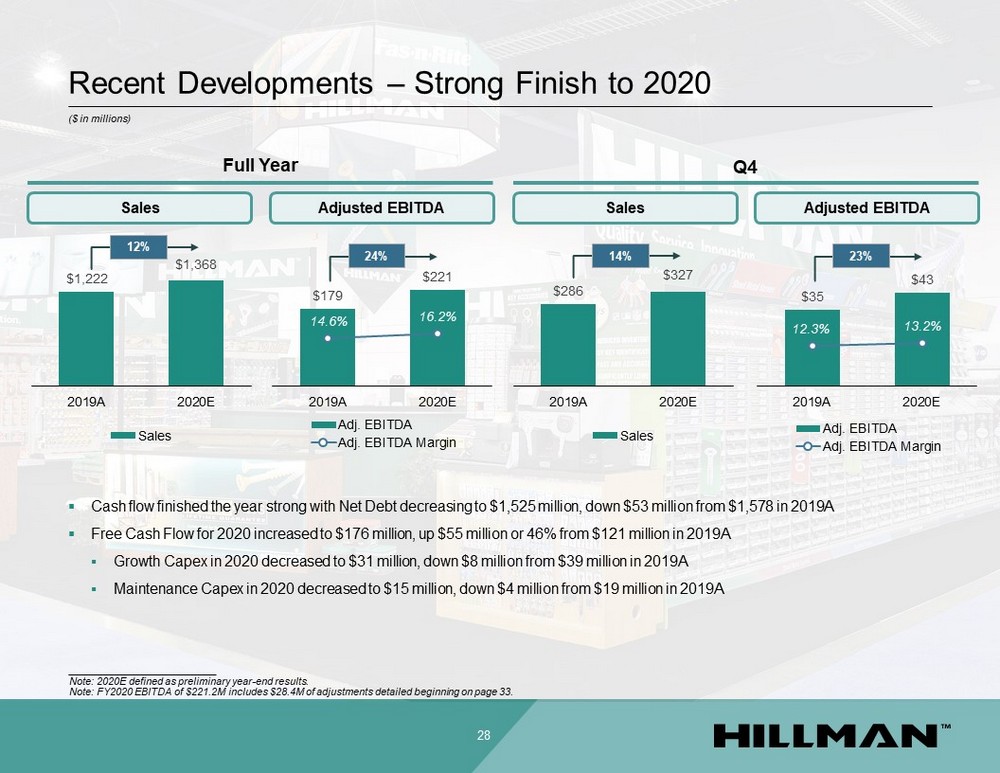
Recent Developments – Strong Finish to 2020 28 __________________________ Note: 2020E defined as preliminary year - end results. Note: FY 2020 EBITDA of $221.2M includes $28.4M of adjustments detailed beginning on page 33. Full Year Q4 12% $1,222 $1,368 2019A 2020E Sales $179 $221 14.6% 16.2% 2019A 2020E Adj. EBITDA Adj. EBITDA Margin 24% 14% $286 $327 2019A 2020E Sales $35 $43 12.3% 13.2% 2019A 2020E Adj. EBITDA Adj. EBITDA Margin 23% Sales Adjusted EBITDA Sales Adjusted EBITDA ▪ Cash flow finished the year strong with Net Debt decreasing to $1,525 million, down $53 million from $1,578 in 2019A ▪ Free Cash Flow for 2020 increased to $176 million, up $55 million or 46% from $121 million in 2019A ▪ Growth Capex in 2020 decreased to $31 million, down $ 8 million from $39 million in 2019A ▪ Maintenance Capex in 2020 decreased to $15 million, down $4 million from $19 million in 2019A ($ in millions)
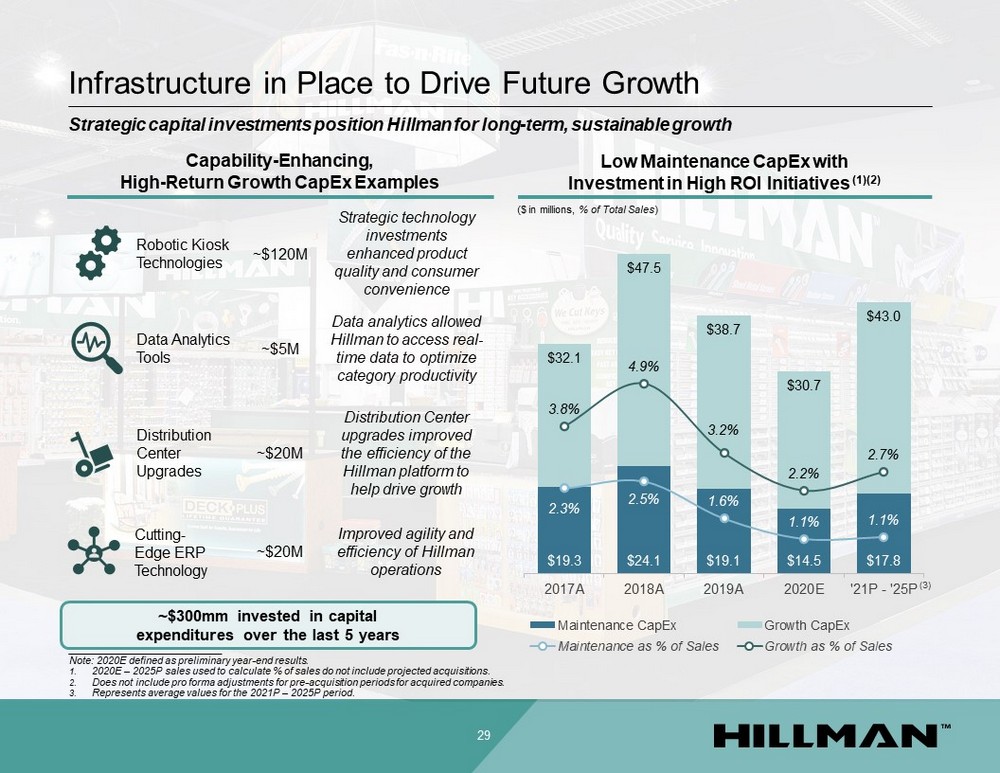
Infrastructure in Place to Drive Future Growth 29 Capability - Enhancing, High - Return Growth CapEx Examples Robotic Kiosk Technologies ~$120M Strategic technology investments enhanced product quality and consumer convenience Cutting - Edge ERP Technology ~$20M Improved agility and efficiency of Hillman operations ___________________________ Note: 2020E defined as preliminary year - end results. 1. 2020E – 2025P sales used to calculate % of sales do not include projected acquisitions. 2. Does not include pro forma adjustments for pre - acquisition periods for acquired companies. 3. Represents average values for the 2021P – 2025P period. ~$300mm invested in capital expenditures over the last 5 years Data Analytics Tools Data analytics allowed Hillman to access real - time data to optimize category productivity ~$5M Distribution Center Upgrades ~$20M Distribution Center upgrades improved the efficiency of the Hillman platform to help drive growth Low Maintenance CapEx with Investment in High ROI Initiatives (1)(2) ($ in millions, % of Total Sales ) $19.3 $24.1 $19.1 $14.5 $17.8 $32.1 $47.5 $38.7 $30.7 $43.0 2.3% 2.5% 1.6% 1.1% 1.1% 3.8% 4.9% 3.2% 2.2% 2.7% 2017A 2018A 2019A 2020E '21P - '25P Maintenance CapEx Growth CapEx Maintenance as % of Sales Growth as % of Sales (3) Strategic capital investments position Hillman for long - term, sustainable growth
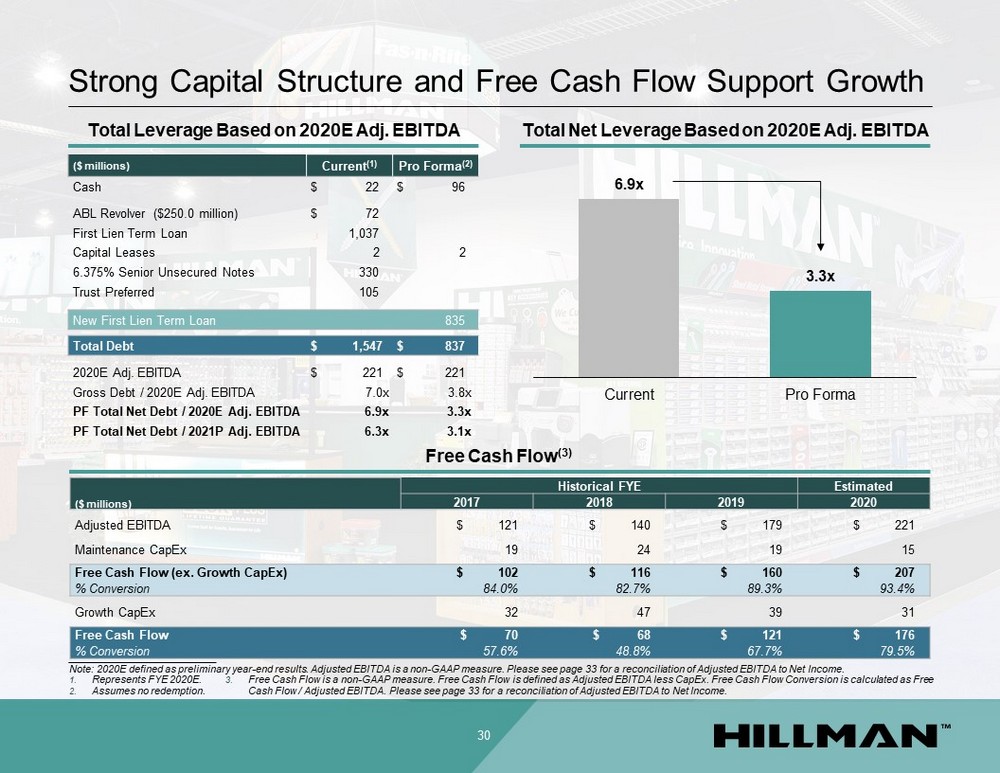
Strong Capital Structure and Free Cash Flow Support Growth 30 Total Net Leverage Based on 2020E Adj. EBITDA 6.9x 3.3x Current Pro Forma Total Leverage Based on 2020E Adj. EBITDA ($ millions) Current (1) Pro Forma (2) Cash $ 22 $ 96 ABL Revolver ($250.0 million) $ 72 First Lien Term Loan 1,037 Capital Leases 2 2 6.375% Senior Unsecured Notes 330 Trust Preferred 105 New First Lien Term Loan 835 Total Debt $ 1,547 $ 837 2020E Adj. EBITDA $ 221 $ 221 Gross Debt / 2020E Adj. EBITDA 7.0x 3.8x PF Total Net Debt / 2020E Adj. EBITDA 6.9x 3.3x PF Total Net Debt / 2021P Adj. EBITDA 6.3x 3.1x Free Cash Flow (3) __________________________ Note: 2020E defined as preliminary year - end results. Adjusted EBITDA is a non - GAAP measure. Please see page 33 for a reconciliat ion of Adjusted EBITDA to Net Income. 1. Represents FYE 2020E. 2. Assumes no redemption. Historical FYE Estimated ($ millions) 2017 2018 2019 2020 Adjusted EBITDA $ 121 $ 140 $ 179 $ 221 Maintenance CapEx 19 24 19 15 Free Cash Flow (ex. Growth CapEx) $ 102 $ 116 $ 160 $ 207 % Conversion 84.0% 82.7% 89.3% 93.4% Growth CapEx 32 47 39 31 Free Cash Flow $ 70 $ 68 $ 121 $ 176 % Conversion 57.6% 48.8% 67.7% 79.5% 3. Free Cash Flow is a non - GAAP measure. Free Cash Flow is defined as Adjusted EBITDA less CapEx. Free Cash Flow Conversion is calc ulated as Free Cash Flow / Adjusted EBITDA. Please see page 33 for a reconciliation of Adjusted EBITDA to Net Income.
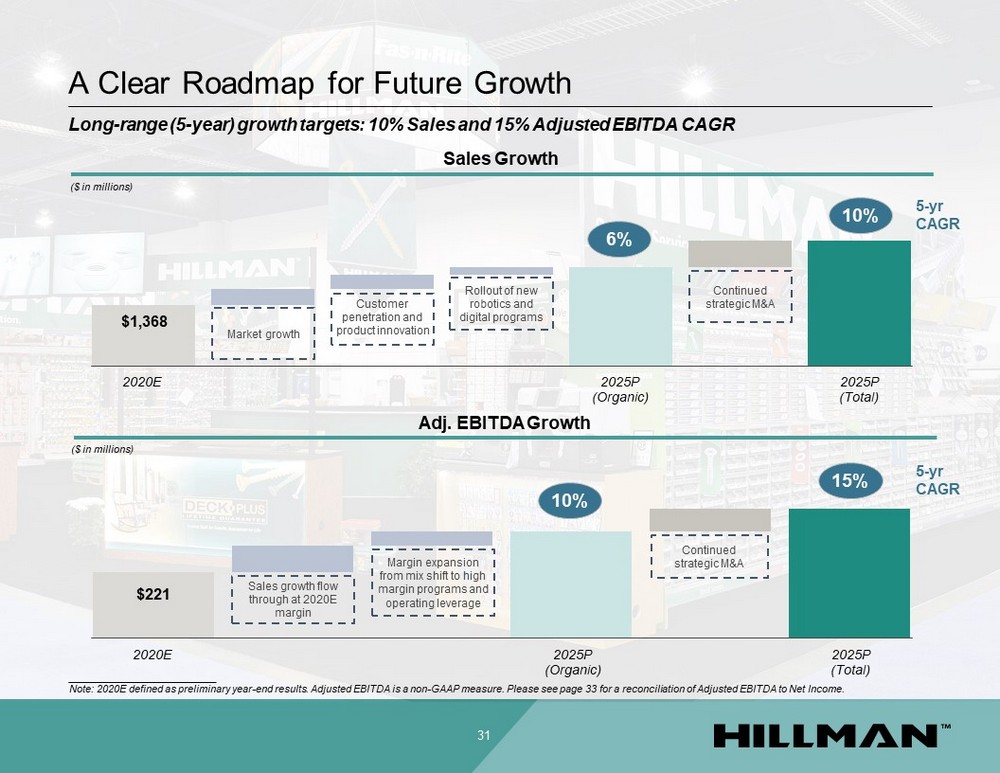
A Clear Roadmap for Future Growth ($ in millions) Adj. EBITDA Growth ($ in millions) Sales Growth $1,368 Market growth 2020E 2025P (Total) 2025P (Organic) Rollout of new robotics and digital programs Continued strategic M&A Sales growth flow through at 2020E margin 2020E 2025P (Total) 2025P (Organic) Continued strategic M&A $221 31 6% 5 - yr CAGR Long - range (5 - year) growth targets: 10% Sales and 15% Adjusted EBITDA CAGR Customer penetration and product innovation Margin expansion from mix shift to high margin programs and operating leverage 10% 10% 5 - yr CAGR 15% __________________________ Note: 2020E defined as preliminary year - end results. Adjusted EBITDA is a non - GAAP measure. Please see page 33 for a reconciliat ion of Adjusted EBITDA to Net Income.
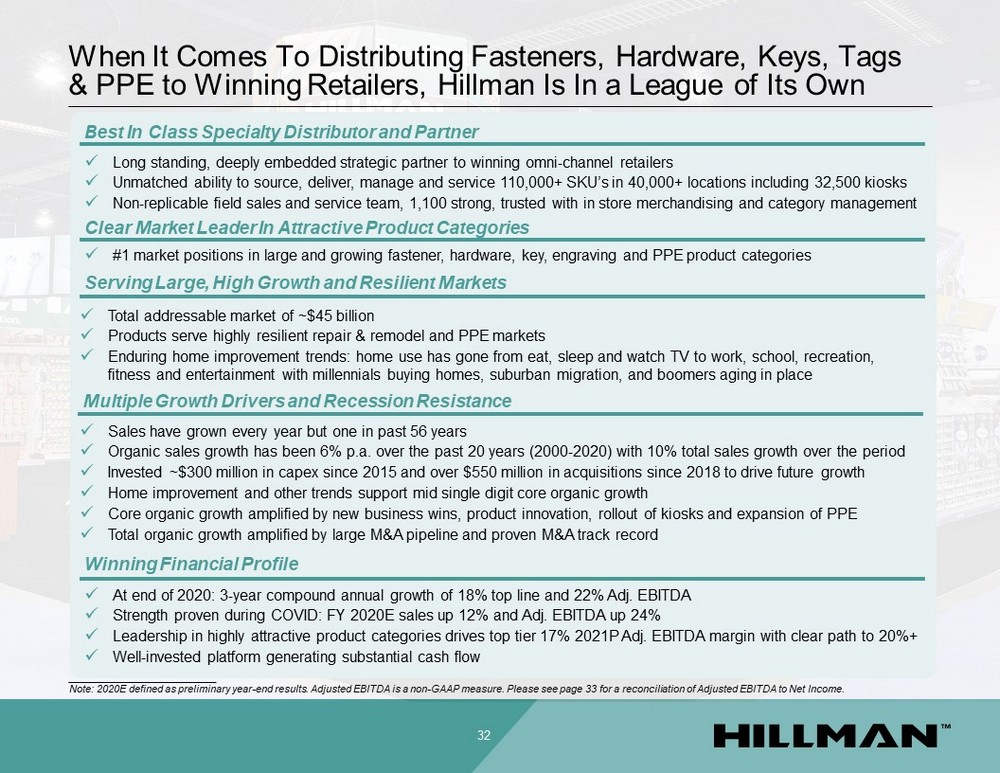
When It Comes To Distributing Fasteners, Hardware, Keys, Tags & PPE to Winning Retailers, Hillman Is In a League of Its Own 32 x At end of 2020: 3 - year compound annual growth of 18% top line and 22% Adj. EBITDA x Strength proven during COVID: FY 2020E sales up 12% and Adj. EBITDA up 24% x Leadership in highly attractive product categories drives top tier 17% 2021P Adj. EBITDA margin with clear path to 20%+ x Well - invested platform generating substantial cash flow Winning Financial Profile x #1 market positions in large and growing fastener, hardware, key, engraving and PPE product categories Clear Market Leader In Attractive Product Categories x Total addressable market of ~$45 billion x Products serve highly resilient repair & remodel and PPE markets x Enduring home improvement trends: home use has gone from eat, sleep and watch TV to work, school, recreation, fitness and entertainment with millennials buying homes, suburban migration, and boomers aging in place Serving Large, High Growth and Resilient Markets Best In Class Specialty Distributor and Partner x Long standing, deeply embedded strategic partner to winning omni - channel retailers x Unmatched ability to source, deliver, manage and service 110,000+ SKU’s in 40,000+ locations including 32,500 kiosks x Non - replicable field sales and service team, 1,100 strong, trusted with in store merchandising and category management x Sales have grown every year but one in past 56 years x Organic sales growth has been 6% p.a. over the past 20 years (2000 - 2020) with 10% total sales growth over the period x Invested ~$300 million in capex since 2015 and over $550 million in acquisitions since 2018 to drive future growth x Home improvement and other trends support mid single digit core organic growth x Core organic growth amplified by new business wins, product innovation, rollout of kiosks and expansion of PPE x Total organic growth amplified by large M&A pipeline and proven M&A track record Multiple Growth Drivers and Recession Resistance __________________________ Note: 2020E defined as preliminary year - end results. Adjusted EBITDA is a non - GAAP measure. Please see page 33 for a reconciliat ion of Adjusted EBITDA to Net Income.
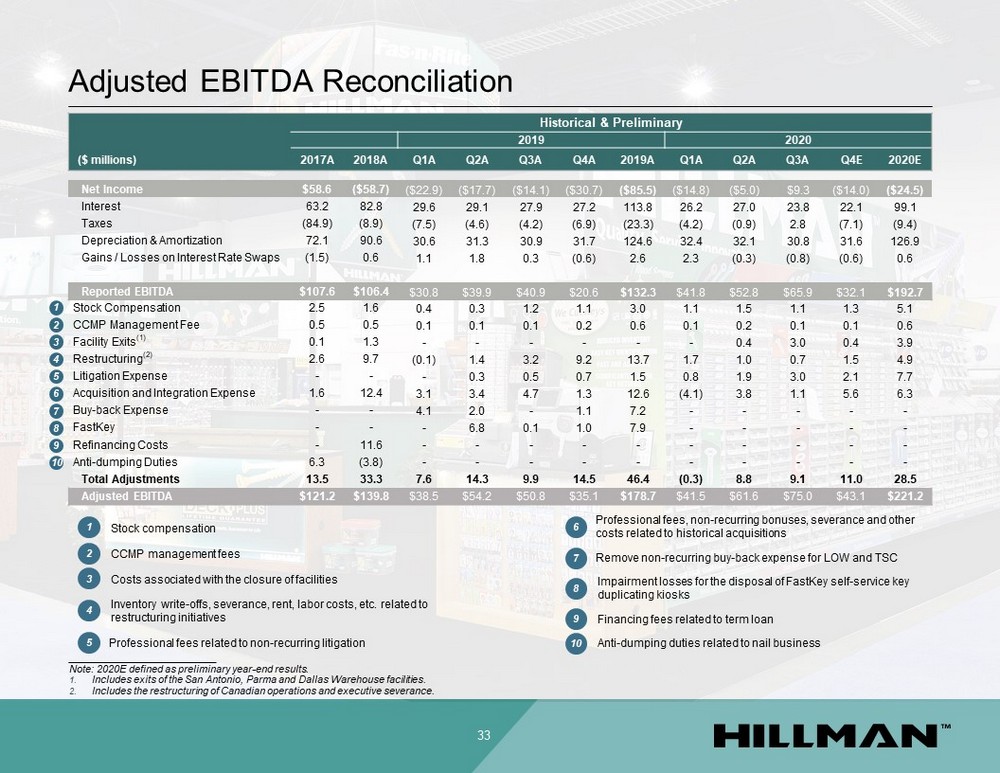
Adjusted EBITDA Reconciliation 33 Historical & Preliminary 2019 2020 ($ millions) 2017A 2018A Q1A Q2A Q3A Q4A 2019A Q1A Q2A Q3A Q4E 2020E Net Income $58.6 ($58.7) ($22.9) ($17.7) ($14.1) ($30.7) ($85.5) ($14.8) ($5.0) $9.3 ($14.0) ($24.5) Interest 63.2 82.8 29.6 29.1 27.9 27.2 113.8 26.2 27.0 23.8 22.1 99.1 Taxes (84.9) (8.9) (7.5) (4.6) (4.2) (6.9) (23.3) (4.2) (0.9) 2.8 (7.1) (9.4) Depreciation & Amortization 72.1 90.6 30.6 31.3 30.9 31.7 124.6 32.4 32.1 30.8 31.6 126.9 Gains / Losses on Interest Rate Swaps (1.5) 0.6 1.1 1.8 0.3 (0.6) 2.6 2.3 (0.3) (0.8) (0.6) 0.6 Reported EBITDA $107.6 $106.4 $30.8 $39.9 $40.9 $20.6 $132.3 $41.8 $52.8 $65.9 $32.1 $192.7 Stock Compensation 2.5 1.6 0.4 0.3 1.2 1.1 3.0 1.1 1.5 1.1 1.3 5.1 CCMP Management Fee 0.5 0.5 0.1 0.1 0.1 0.2 0.6 0.1 0.2 0.1 0.1 0.6 Facility Exits (1) 0.1 1.3 - - - - - - 0.4 3.0 0.4 3.9 Restructuring (2) 2.6 9.7 (0.1) 1.4 3.2 9.2 13.7 1.7 1.0 0.7 1.5 4.9 Litigation Expense - - - 0.3 0.5 0.7 1.5 0.8 1.9 3.0 2.1 7.7 Acquisition and Integration Expense 1.6 12.4 3.1 3.4 4.7 1.3 12.6 (4.1) 3.8 1.1 5.6 6.3 Buy - back Expense - - 4.1 2.0 - 1.1 7.2 - - - - - FastKey - - - 6.8 0.1 1.0 7.9 - - - - - Refinancing Costs - 11.6 - - - - - - - - - - Anti - dumping Duties 6.3 (3.8) - - - - - - - - - - Total Adjustments 13.5 33.3 7.6 14.3 9.9 14.5 46.4 (0.3) 8.8 9.1 11.0 28.5 Adjusted EBITDA $121.2 $139.8 $38.5 $54.2 $50.8 $35.1 $178.7 $41.5 $61.6 $75.0 $43.1 $221.2 1 2 3 4 5 7 6 8 9 10 1 Stock compensation 2 CCMP management fees 3 Costs associated with the closure of facilities 4 Inventory write - offs, severance, rent, labor costs, etc. related to restructuring initiatives 5 Professional fees related to non - recurring litigation 6 Professional fees, non - recurring bonuses, severance and other costs related to historical acquisitions 7 Remove non - recurring buy - back expense for LOW and TSC 8 Impairment losses for the disposal of FastKey self - service key duplicating kiosks 9 Financing fees related to term loan 10 Anti - dumping duties related to nail business __________________________ Note: 2020E defined as preliminary year - end results. 1. Includes exits of the San Antonio, Parma and Dallas Warehouse facilities. 2. Includes the restructuring of Canadian operations and executive severance.
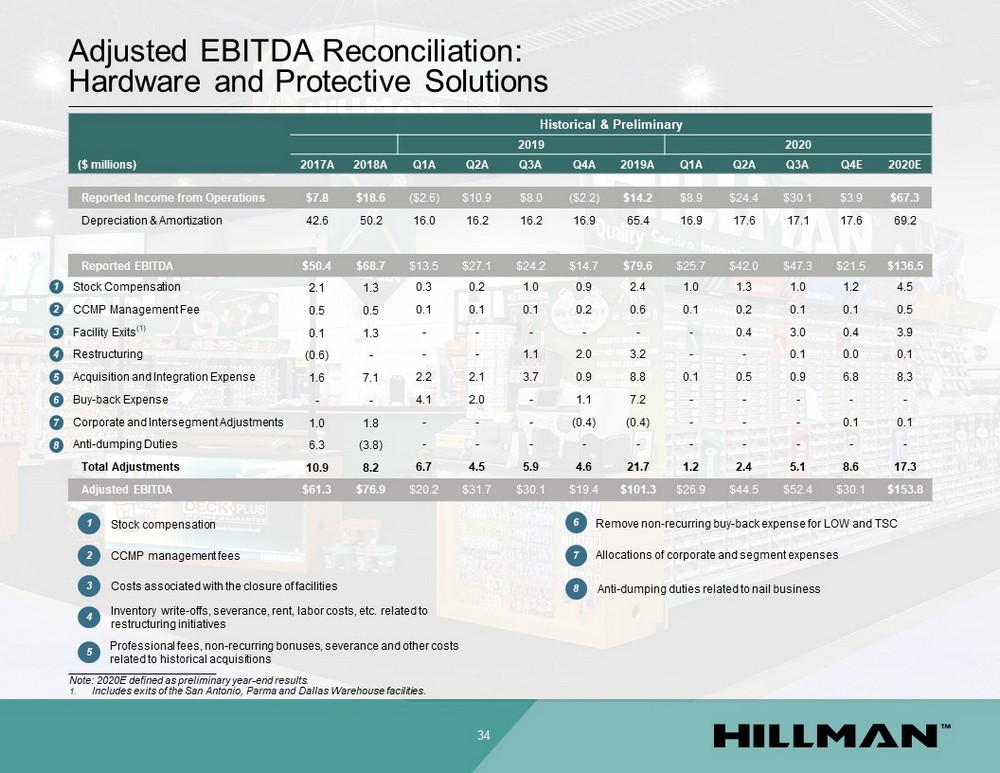
Adjusted EBITDA Reconciliation: Hardware and Protective Solutions 34 Historical & Preliminary 2019 2020 ($ millions) 2017A 2018A Q1A Q2A Q3A Q4A 2019A Q1A Q2A Q3A Q4E 2020E Reported Income from Operations $7.8 $18.6 ($2.6) $10.9 $8.0 ($2.2) $14.2 $8.9 $24.4 $30.1 $3.9 $67.3 Depreciation & Amortization 42.6 50.2 16.0 16.2 16.2 16.9 65.4 16.9 17.6 17.1 17.6 69.2 Reported EBITDA $50.4 $68.7 $13.5 $27.1 $24.2 $14.7 $79.6 $25.7 $42.0 $47.3 $21.5 $136.5 Stock Compensation 2.1 1.3 0.3 0.2 1.0 0.9 2.4 1.0 1.3 1.0 1.2 4.5 CCMP Management Fee 0.5 0.5 0.1 0.1 0.1 0.2 0.6 0.1 0.2 0.1 0.1 0.5 Facility Exits (1) 0.1 1.3 - - - - - - 0.4 3.0 0.4 3.9 Restructuring (0.6) - - - 1.1 2.0 3.2 - - 0.1 0.0 0.1 Acquisition and Integration Expense 1.6 7.1 2.2 2.1 3.7 0.9 8.8 0.1 0.5 0.9 6.8 8.3 Buy - back Expense - - 4.1 2.0 - 1.1 7.2 - - - - - Corporate and Intersegment Adjustments 1.0 1.8 - - - (0.4) (0.4) - - - 0.1 0.1 Anti - dumping Duties 6.3 (3.8) - - - - - - - - - - Total Adjustments 10.9 8.2 6.7 4.5 5.9 4.6 21.7 1.2 2.4 5.1 8.6 17.3 Adjusted EBITDA $61.3 $76.9 $20.2 $31.7 $30.1 $19.4 $101.3 $26.9 $44.5 $52.4 $30.1 $153.8 1 2 3 4 5 7 6 8 1 Stock compensation 2 CCMP management fees 3 Costs associated with the closure of facilities 4 Inventory write - offs, severance, rent, labor costs, etc. related to restructuring initiatives 5 Professional fees, non - recurring bonuses, severance and other costs related to historical acquisitions 6 Remove non - recurring buy - back expense for LOW and TSC 7 Allocations of corporate and segment expenses 8 Anti - dumping duties related to nail business __________________________ Note: 2020E defined as preliminary year - end results. 1. Includes exits of the San Antonio, Parma and Dallas Warehouse facilities.
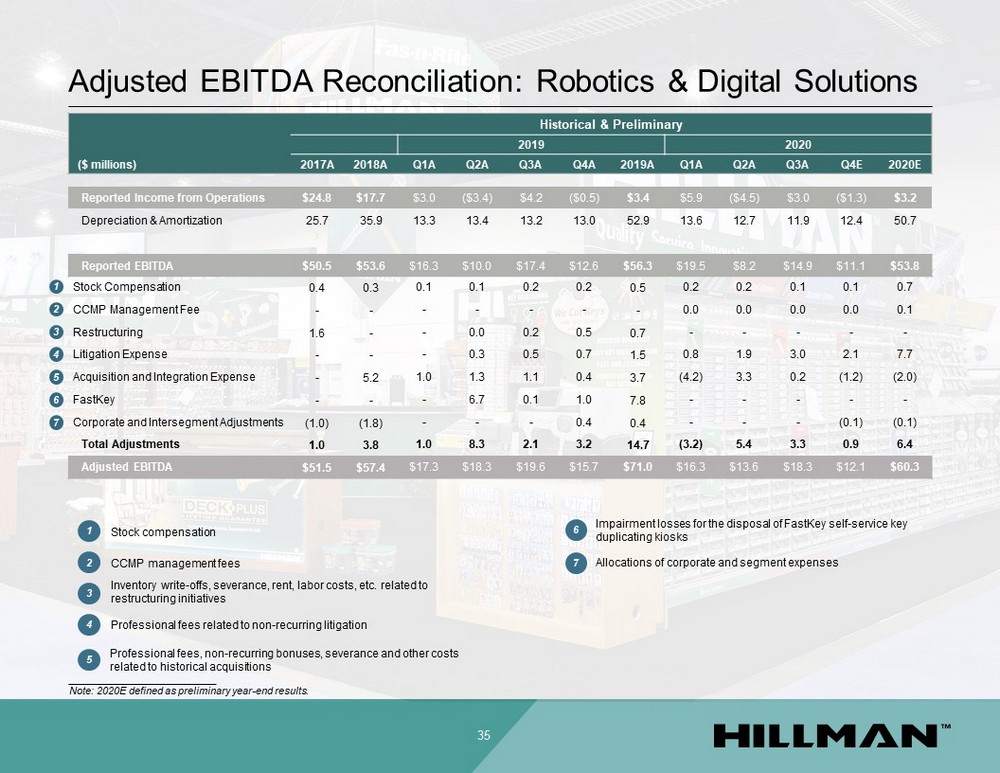
Adjusted EBITDA Reconciliation: Robotics & Digital Solutions 35 Historical & Preliminary 2019 2020 ($ millions) 2017A 2018A Q1A Q2A Q3A Q4A 2019A Q1A Q2A Q3A Q4E 2020E Reported Income from Operations $24.8 $17.7 $3.0 ($3.4) $4.2 ($0.5) $3.4 $5.9 ($4.5) $3.0 ($1.3) $3.2 Depreciation & Amortization 25.7 35.9 13.3 13.4 13.2 13.0 52.9 13.6 12.7 11.9 12.4 50.7 Reported EBITDA $50.5 $53.6 $16.3 $10.0 $17.4 $12.6 $56.3 $19.5 $8.2 $14.9 $11.1 $53.8 Stock Compensation 0.4 0.3 0.1 0.1 0.2 0.2 0.5 0.2 0.2 0.1 0.1 0.7 CCMP Management Fee - - - - - - - 0.0 0.0 0.0 0.0 0.1 Restructuring 1.6 - - 0.0 0.2 0.5 0.7 - - - - - Litigation Expense - - - 0.3 0.5 0.7 1.5 0.8 1.9 3.0 2.1 7.7 Acquisition and Integration Expense - 5.2 1.0 1.3 1.1 0.4 3.7 (4.2) 3.3 0.2 (1.2) (2.0) FastKey - - - 6.7 0.1 1.0 7.8 - - - - - Corporate and Intersegment Adjustments (1.0) (1.8) - - - 0.4 0.4 - - - (0.1) (0.1) Total Adjustments 1.0 3.8 1.0 8.3 2.1 3.2 14.7 (3.2) 5.4 3.3 0.9 6.4 Adjusted EBITDA $51.5 $57.4 $17.3 $18.3 $19.6 $15.7 $71.0 $16.3 $13.6 $18.3 $12.1 $60.3 1 2 3 4 5 7 6 1 Stock compensation 2 CCMP management fees 3 Inventory write - offs, severance, rent, labor costs, etc. related to restructuring initiatives 4 Professional fees related to non - recurring litigation 5 Professional fees, non - recurring bonuses, severance and other costs related to historical acquisitions 6 Impairment losses for the disposal of FastKey self - service key duplicating kiosks 7 Allocations of corporate and segment expenses __________________________ Note: 2020E defined as preliminary year - end results.
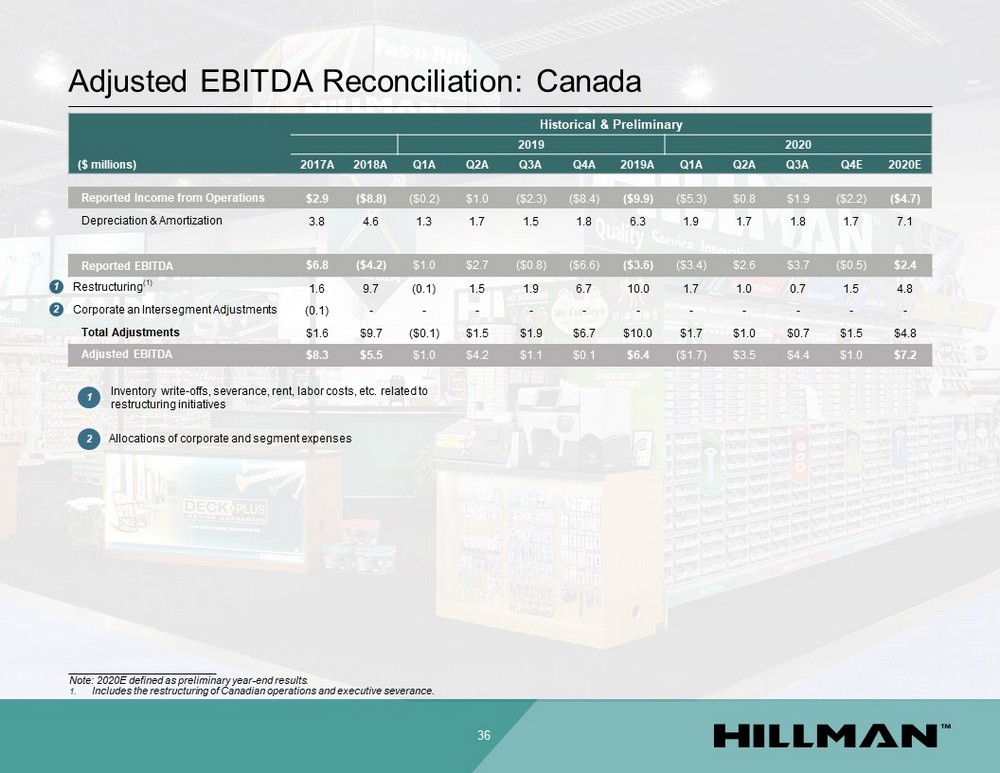
Adjusted EBITDA Reconciliation: Canada 36 __________________________ Note: 2020E defined as preliminary year - end results. 1. Includes the restructuring of Canadian operations and executive severance. Historical & Preliminary 2019 2020 ($ millions) 2017A 2018A Q1A Q2A Q3A Q4A 2019A Q1A Q2A Q3A Q4E 2020E Reported Income from Operations $2.9 ($8.8) ($0.2) $1.0 ($2.3) ($8.4) ($9.9) ($5.3) $0.8 $1.9 ($2.2) ($4.7) Depreciation & Amortization 3.8 4.6 1.3 1.7 1.5 1.8 6.3 1.9 1.7 1.8 1.7 7.1 Reported EBITDA $6.8 ($4.2) $1.0 $2.7 ($0.8) ($6.6) ($3.6) ($3.4) $2.6 $3.7 ($0.5) $2.4 Restructuring (1) 1.6 9.7 (0.1) 1.5 1.9 6.7 10.0 1.7 1.0 0.7 1.5 4.8 Corporate an Intersegment Adjustments (0.1) - - - - - - - - - - - Total Adjustments $1.6 $9.7 ($0.1) $1.5 $1.9 $6.7 $10.0 $1.7 $1.0 $0.7 $1.5 $4.8 Adjusted EBITDA $8.3 $5.5 $1.0 $4.2 $1.1 $0.1 $6.4 ($1.7) $3.5 $4.4 $1.0 $7.2 1 2 1 Inventory write - offs, severance, rent, labor costs, etc. related to restructuring initiatives 2 Allocations of corporate and segment expenses
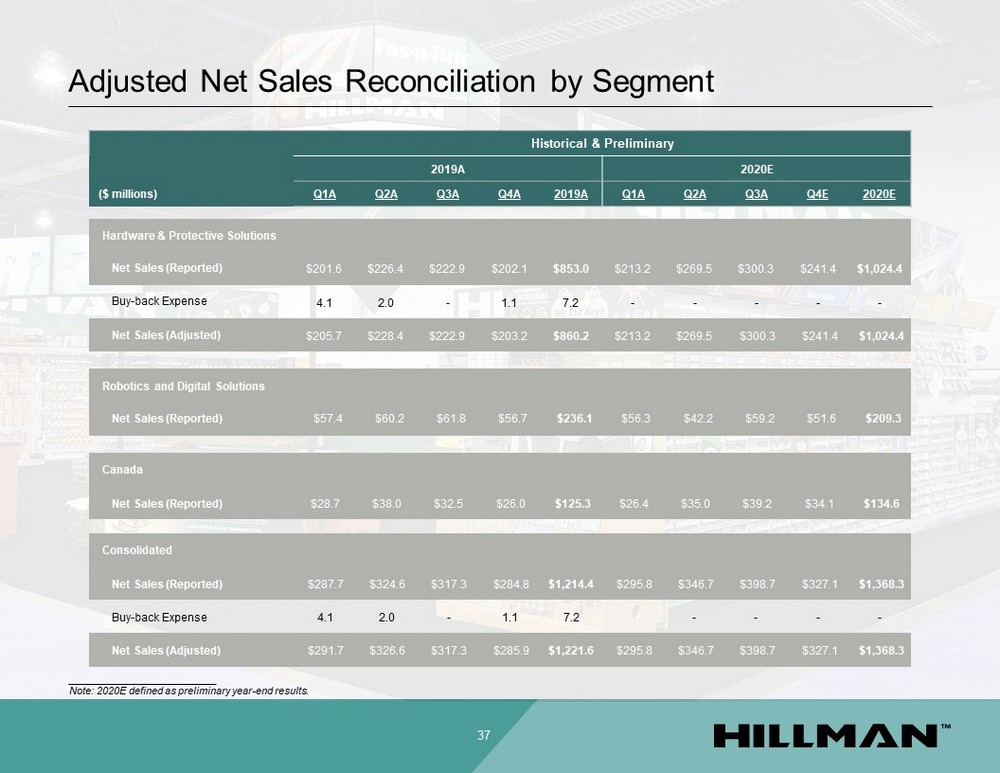
Adjusted Net Sales Reconciliation by Segment 37 Historical & Preliminary 2019A 2020E ($ millions) Q1A Q2A Q3A Q4A 2019A Q1A Q2A Q3A Q4E 2020E Hardware & Protective Solutions Net Sales (Reported) $201.6 $226.4 $222.9 $202.1 $853.0 $213.2 $269.5 $300.3 $241.4 $1,024.4 Buy - back Expense 4.1 2.0 - 1.1 7.2 - - - - - Net Sales (Adjusted) $205.7 $228.4 $222.9 $203.2 $860.2 $213.2 $269.5 $300.3 $241.4 $1,024.4 Robotics and Digital Solutions Net Sales (Reported) $57.4 $60.2 $61.8 $56.7 $236.1 $56.3 $42.2 $59.2 $51.6 $209.3 Canada Net Sales (Reported) $28.7 $38.0 $32.5 $26.0 $125.3 $26.4 $35.0 $39.2 $34.1 $134.6 Consolidated Net Sales (Reported) $287.7 $324.6 $317.3 $284.8 $1,214.4 $295.8 $346.7 $398.7 $327.1 $1,368.3 Buy - back Expense 4.1 2.0 - 1.1 7.2 - - - - Net Sales (Adjusted) $291.7 $326.6 $317.3 $285.9 $1,221.6 $295.8 $346.7 $398.7 $327.1 $1,368.3 __________________________ Note: 2020E defined as preliminary year - end results.
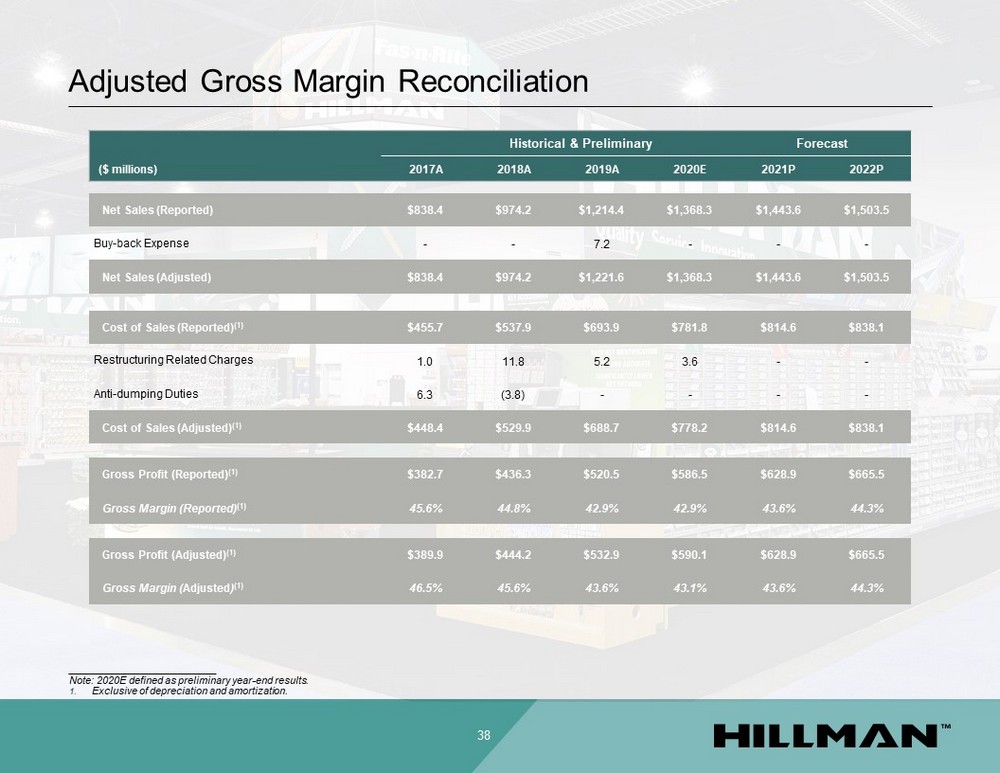
Adjusted Gross Margin Reconciliation 38 Historical & Preliminary Forecast ($ millions) 2017A 2018A 2019A 2020E 2021P 2022P Net Sales (Reported) $838.4 $974.2 $1,214.4 $1,368.3 $1,443.6 $1,503.5 Buy - back Expense - - 7.2 - - - Net Sales (Adjusted) $838.4 $974.2 $1,221.6 $1,368.3 $1,443.6 $1,503.5 Cost of Sales (Reported) (1) $455.7 $537.9 $693.9 $781.8 $814.6 $838.1 Restructuring Related Charges 1.0 11.8 5.2 3.6 - - Anti - dumping Duties 6.3 (3.8) - - - - Cost of Sales (Adjusted) (1) $448.4 $529.9 $688.7 $778.2 $814.6 $838.1 Gross Profit (Reported) (1) $382.7 $436.3 $520.5 $586.5 $628.9 $665.5 Gross Margin (Reported) (1) 45.6% 44.8% 42.9% 42.9% 43.6% 44.3% Gross Profit (Adjusted) (1) $389.9 $444.2 $532.9 $590.1 $628.9 $665.5 Gross Margin ( Adjusted ) (1) 46.5% 45.6% 43.6% 43.1% 43.6% 44.3% __________________________ Note: 2020E defined as preliminary year - end results. 1. Exclusive of depreciation and amortization.